Executive Overview: What Is an Institutional Commercial Real Estate Investment Presentation?
A commercial real estate investment presentation is an institutional transaction document used by real estate private equity (REPE) acquisitions leads, commercial developers, sponsors, and brokers to secure LP equity commitments, mezzanine financing, or senior debt facilities for a specific property transaction. Unlike early-stage tech pitch decks that focus on user acquisition, addressable market narratives, and vision statements, a commercial real estate pitch deck is an audited financial underwriting document. It must prove to an institutional Investment Committee (IC) that a property's unlevered and levered cash flows, physical condition, tenant credit quality, submarket supply/demand dynamics, and capital expenditure business plan justify allocating millions of dollars in capital at an acceptable risk-adjusted rate of return.
In institutional deal underwriting, consumer AI slide generators and generic presentation templates routinely fail. Generic tools generate decorative stock photographs of modern office towers, superficial bullet points about 'desirable urban submarkets', and decorative cards that fail to withstand five minutes of scrutiny from a skeptical private equity investment committee. Serious real estate investors—such as Blackstone, Starwood, Brookfield, Hines, institutional family offices, and bank credit syndicates—evaluate deals on numerical precision. They require an audited pro forma Net Operating Income (NOI) bridge, granular rent roll aging and tenant concentration tables, debt yield calculations, unencumbered lease rollover schedules (WALT), return on cost (ROC) for unit renovations, and multi-scenario exit capitalization rate sensitivity matrices.
This guide provides the complete blueprint for constructing an institutional-grade commercial real estate pitch deck and Investment Committee memo. It covers the core narrative structure, mathematical cash flow decompositions, tenant credit grading frameworks, submarket demographic validation methods, capital stack engineering, and AI prompt workflows that enable deal teams to transform raw Excel underwriting models into boardroom-ready PowerPoint presentations.
Key Takeaways: Building High-Stakes CRE Pitch Decks That Clear Investment Committees
- Underwrite from Net Operating Income (NOI), Not Top-Line Hype: Institutional investors evaluate properties on true cash-generating ability. Decks must present a transparent cash flow waterfall starting from Gross Potential Rent (GPR), deducting vacancy, concessions, and loss-to-lease to reach Effective Gross Income (EGI), followed by categorized operating expenses, real estate taxes, and capital reserves to establish defensible baseline NOI.
- Separate In-Place Basis from Value-Add Speculation: Never conflate current in-place cash yields with post-renovation pro forma projections. Top sponsors clearly delineate Year 1 In-Place Cap Rate (e.g., 5.4%) from the Stabilized Yield-on-Cost (e.g., 7.2%), documenting the exact dollarized capital expenditure program required to capture the spread.
- Dissect Lease Rollover Risk and Tenant Credit Concentration: Investment committees closely scrutinize Weighted Average Lease Term (WALT). Present a visual lease expiration schedule by year, identify any tenant representing over 10% of gross leasable area (GLA), and isolate contractual rent bumps versus mark-to-market upside.
- Structure the Capital Stack with Strict Debt Yield and DSCR Disciplines: Do not hide aggressive leverage behind low floating rates. Lenders and LP partners demand clear Senior LTV, Debt Service Coverage Ratio (DSCR >= 1.35x), and minimum Debt Yield (>= 9.0% on exit), accompanied by SOFR interest rate cap hedges and forward-starting swap structures.
- Model Dual-Variable Exit Cap Rate and Terminal NOI Sensitivity: Transparently show how returns react to adverse market shifts. Provide a multi-scenario sensitivity grid testing exit cap rate expansion (+25, +50, +75, and +100 basis points) against terminal NOI growth to demonstrate that equity capital remains protected even during severe liquidity contractions.
- Define Institutional LP/GP Distribution Waterfalls Explicitly: Document the exact hurdle mechanics, whether European (whole-fund return of capital first) or American (deal-by-deal with clawbacks), preferred return rates (typically 8.0%), and tiered GP carried interest promotes (80/20, 70/30, and 50/50 splits).
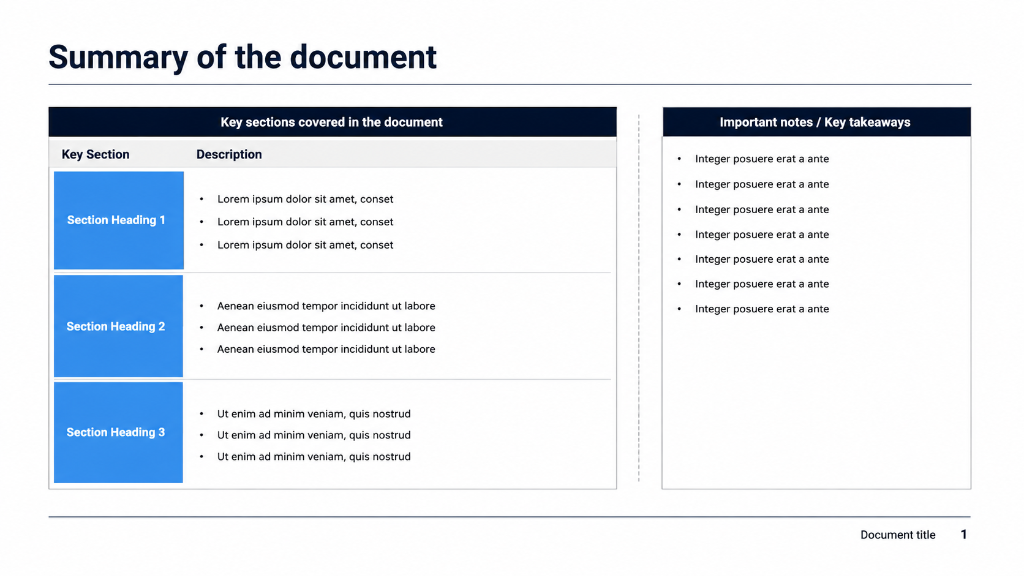
Exhibit 1: Commercial Real Estate Deal Summary & Underwriting Snapshot
The Anatomy of an Institutional CRE Investment Deck: Core Narrative Architecture
A successful commercial real estate pitch deck adheres to a rigorous, five-part narrative architecture designed to answer every question an Investment Committee, equity partner, or credit officer will ask before issuing capital. Institutional decks typically range between 20 and 28 slides, accompanied by a comprehensive technical appendix containing full Argus models, environmental phase reports, property condition assessments (PCA), and title commitments.
Part 1: Executive Deal Summary & Sponsor Thesis (Slides 1-4). The deck opens with the transaction headline, investment archetype (Core, Core-Plus, Value-Add, or Opportunistic), asset physical overview (property name, address, asset class, gross leasable area / units, year built / renovated, current physical and economic occupancy), headline transaction terms (purchase price, price per square foot / door, debt financing assumptions, equity requirement), and the core value creation thesis in three bulleted action statements. A credibility block highlights the sponsor's track record, local market presence, assets under management (AUM), and historical realized IRR on comparable assets in the target submarket.
Part 2: Location Submarket & Micro-Market Supply/Demand Drivers (Slides 5-9). This section establishes the macro and microeconomic tailwinds validating the acquisition. It includes submarket demographic profiles (median household income, 3-mile population growth, employment diversity, major corporate anchors, transportation arteries, and public transit nodes). Crucially, this section provides an audited competitive supply pipeline analysis, mapping all properties currently under construction, planned, or in permitting within a 5-mile radius. It compares historical trailing 5-year net absorption against upcoming deliveries to prove that local demand will absorb new inventory without triggering pricing wars or concessions.
Part 3: In-Place Financials, Historical Operating Track Record & Pro Forma Underwriting (Slides 10-14). Moving beyond high-level summaries, this module delivers the detailed financial evidence. It provides three years of historical property operating statements (T-12, T-24, and T-36 trailing P&Ls), reconciles historical operating variances, and presents the unencumbered pro forma Net Operating Income (NOI) bridge. It includes a complete rent roll stratification analyzing in-place leases, contractual escalations, upcoming lease expirations by year, and tenant credit ratings, proving the baseline cash stability of the asset.
Part 4: Value-Add Capital Expenditure Program & Business Plan Execution (Slides 15-18). For Core-Plus, Value-Add, and Opportunistic strategies, this section outlines the operational modernization playbook. It details the exact dollarized CapEx budget broken down into interior unit renovations, common area amenity upgrades, deferred maintenance remediation, sustainability/energy efficiency retrofits, and exterior curb appeal enhancements. Each line item is tied to an explicit Return on Cost (ROC) hurdle, showing historical rent spreads achieved across recently renovated comparable properties in the immediate submarket.
Part 5: Capital Stack, Debt Terms, LP/GP Distribution Waterfall & Sensitivity Analysis (Slides 19-24). The deck concludes with financial engineering and governance. It outlines the total Sources & Uses of Funds (balanced to the penny), senior mortgage financing terms (lender type, interest rate, fixed vs. floating spread, interest-only period, amortization schedule, covenants), mezzanine/preferred equity tranches, and the LP/GP promote waterfall. It finishes with robust dual-variable sensitivity tables proving that the deal withstands exit cap rate expansion, increased vacancy, and higher borrowing costs while preserving principal equity.
Table 1: Institutional Commercial Real Estate Underwriting Metrics & Hurdle Thresholds
Standard financial underwriting metrics and benchmark performance thresholds required by institutional Real Estate Private Equity (REPE) Investment Committees and debt syndicate lenders across asset classes.
| Metric Name | Underwriting Definition | Typical Institutional Hurdle / Target | Investment Committee Red Flag |
|---|---|---|---|
| In-Place Capitalization Rate (Going-In Cap Rate) | Trailing 12-Month Net Operating Income (T-12 NOI) divided by the Contract Purchase Price before transaction costs and capital reserves. | 5.00% - 6.50% (Core-Plus / Value-Add industrial, multifamily, grocery-anchored retail in prime MSAs). | Underwriting going-in cap rates below submarket prevailing borrowing costs (negative leverage) without contractually guaranteed lease-up or immediate mark-to-market upside. |
| Stabilized Yield-on-Cost (Return on Cost / ROC) | Stabilized Year 2-3 Net Operating Income divided by the Total Capital Basis (Purchase Price + Transaction Costs + Total CapEx Budget). | 125 to 200 bps spread above prevailing market cap rate (e.g., 7.00% ROC vs. 5.25% market cap rate). | Yield-on-cost spread < 100 bps over market exit cap rate, meaning the sponsor is taking construction, leasing, and execution risk without adequate return compensation. |
| Levered Internal Rate of Return (IRR) | Annualized compound rate of return on invested equity over the underwritten holding period (typically 3 to 7 years), net of all debt service and fees. | 14.0% - 18.0% (Value-Add target net to LPs); 18.0% - 24.0%+ (Opportunistic / Ground-Up Development). | Projecting >20% levered IRR driven predominantly by speculative terminal cap rate compression rather than operational NOI growth and debt paydown. |
| Equity Multiple (MOIC) | Total cumulative cash distributions received plus final equity capital return upon disposition divided by total equity invested ($Total Return / Total Equity$). | 1.80x - 2.25x for 5-year Value-Add holding periods; 1.50x - 1.75x for 3-year repositionings. | Equity multiple < 1.60x on a 5-year hold, failing to compensate limited partners for illiquidity and execution risk relative to risk-free treasury yields. |
| Debt Service Coverage Ratio (DSCR) | Net Operating Income (NOI) divided by total annual debt service (annual interest plus principal amortization). | Minimum 1.30x - 1.45x under in-place cash flows; expanding to >= 1.75x under stabilized operations. | In-place DSCR < 1.20x or negative cash flow post-debt service requiring unfunded operating cash deficit escrows to service interest payments. |
| Debt Yield (Lender Underwriting Metric) | Net Operating Income (NOI) divided by the total outstanding loan principal ($NOI / Total Loan Balance$), expressed as a percentage. | Minimum 8.50% - 10.00% under in-place operations; >= 10.50% at stabilization for floating-rate construction or bridge loans. | Debt yield < 8.00% in a normalized 5.00%+ SOFR environment, which triggers loan resizing, cash-in refinancing demands, or cash flow sweeps. |
| Weighted Average Lease Term (WALT) | The average remaining contractual lease duration of all commercial tenants, weighted by gross leasable area (GLA) or annual rent revenue. | Minimum 4.5 - 7.0+ years for commercial/industrial assets; 8.0 - 12.0+ years for single-tenant net lease (STNL). | WALT < 3.0 years with concentrated lease rollover (>30% of total revenue expiring within 24 months) without fully pre-funded tenant improvement (TI) and leasing commission (LC) reserves. |
Pro Forma NOI Modeling: Deconstructing Cash Flows from Gross Potential Rent to Levered Cash Flow
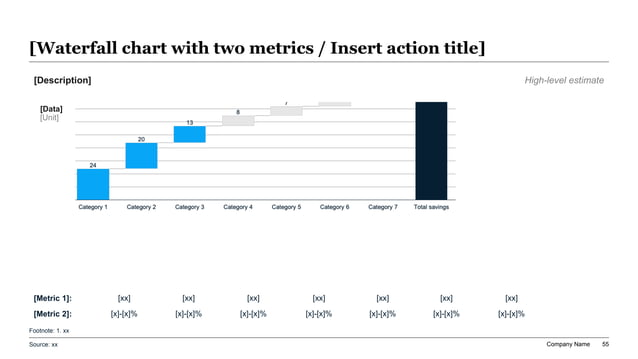
The single most scrutinized slide in any commercial real estate presentation is the Pro Forma Cash Flow Waterfall. Savvy investors skip marketing imagery and immediately audit the property P&L line by line. A credible presentation must demonstrate absolute mathematical integrity across the standardized pro forma sequence:
1. Gross Potential Rent (GPR) to Effective Gross Income (EGI). The model begins with Gross Potential Rent (100% of leasable area leased at current in-place contract rates or market rent for vacant space). From GPR, the sponsor must explicitly deduct: (a) Loss-to-Lease (contractual rents currently below market rent), (b) Concessions & Free Rent amortized across lease terms, and (c) Physical & Economic Vacancy (typically underwritten at 5.0% to 10.0% even if the building is currently 100% occupied, reflecting structural tenant turnover). Adding Expense Reimbursements (triple-net CAM recoveries, insurance, and property tax pass-throughs) and Miscellaneous Income (parking, storage, antenna, billboard, and pet fees) establishes Effective Gross Income (EGI).
2. Operating Expenses (OpEx) to Net Operating Income (NOI). From EGI, the pro forma subtracts all operating costs required to maintain and manage the property: property management fees (typically 2.5% to 4.0% of EGI), on-site payroll and administrative expenses, contract services (landscaping, janitorial, security, trash removal), utilities (common area electric, gas, water/sewer), repairs & maintenance (R&M), property and casualty insurance, and real estate taxes. Crucially, property taxes must be underwritten to the anticipated post-sale reassessment value, not the seller's artificially low historical tax bill. EGI minus total OpEx yields Net Operating Income (NOI)—the pure, unencumbered operating profit of the real estate.
3. NOI to Net Levered Cash Flow (Below-the-Line Adjustments). To establish true distributable cash flow for equity investors, the sponsor must apply below-the-line capital deductions: (a) Capital Replacement Reserves (standardized escrows of $0.25 to $0.50 per square foot or $300 to $500 per unit per year for roofs, paving, and mechanical replacements), (b) Tenant Improvements & Leasing Commissions (TI/LCs underwritten for commercial lease renewals and new tenancies), and (c) Senior Debt Service (annual interest and principal amortization payments). The remaining figure is Net Levered Cash Flow, representing the actual cash yield distributed to LP and GP investors.
Exhibit 2: Pro Forma Net Operating Income (NOI) & Levered Cash Flow Waterfall
Rent Roll Analysis & Lease Rollover Governance: Dissecting Tenant Quality and Expiration Risk
In commercial property underwriting, the rent roll represents the underlying contractual engine backing all projected cash flows. A superficial high-level summary that merely states 'Property is 94% occupied' will be immediately challenged by institutional investors. An executive-ready presentation must provide a granular breakdown of the rent roll across three critical dimensions: expiration timing, tenant credit concentration, and contractual rent escalations.
1. Weighted Average Lease Term (WALT) & Expiration Lumping. Investment committees dread 'lease rollover cliffs'—scenarios where 30% to 50% of the building's leasable area expires in a single 12-month period, creating catastrophic vacancy risk if market conditions soften or the anchor tenant consolidates. The presentation must feature a stacked bar chart mapping contractual lease expirations by year over the underwritten hold period. Sponsors should highlight the percentage of total net rentable area (NRA) and percentage of total base rent expiring annually, demonstrating that no single year exceeds 15% to 20% of the total rent roll unless a fully pre-funded tenant re-leasing reserve is built into the capital stack.
2. Tenant Credit Rating & Industry Diversification. For industrial, office, and retail properties, the deck must classify top tenants by credit quality: Investment Grade (BBB- / Baa3 or higher by S&P/Moody's), Public Non-Rated, Large Regional Enterprise, or Local SMB. For retail assets, the presentation must clearly delineate Anchor Tenants, Shadow Anchors, and In-Line Retailers, reporting trailing-12-month tenant sales per square foot and occupancy cost ratios ($Annual Rent / Tenant Gross Sales$, where health ratios below 10% to 12% indicate durable, profitable tenant locations).
3. Contractual Rent Escalations & Mark-to-Market Upside. Investors look for built-in inflation protection. The presentation should display the weighted average contractual rent bump (e.g., 3.0% to 3.5% annual fixed escalators for industrial, or CPI-indexed caps). Furthermore, top sponsors present a 'Mark-to-Market Rent Spread Analysis', comparing each in-place tenant's contractual rate against prevailing new-lease market rates across comparable buildings in the submarket, demonstrating quantified organic revenue upside as legacy leases roll over.
Checklist 1: Commercial Rent Roll & Lease Diligence Verification
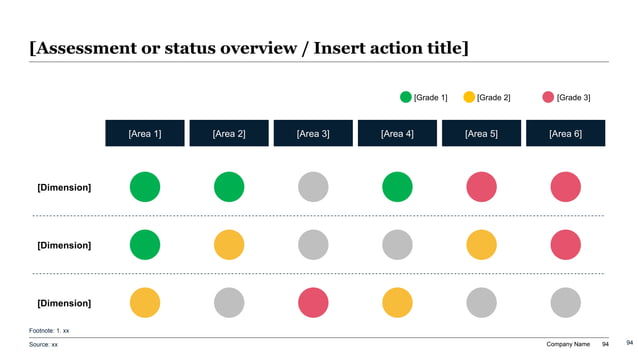
Exhibit 3: Rent Roll Rollover & Tenant Credit Risk Assessment Matrix
Submarket Supply/Demand Fundamentals: Validating Demographic Feasibility and Micro-Location Absorption
An institutional real estate presentation cannot rely on generic regional statistics (e.g., 'Dallas-Fort Worth is growing'). Real estate is intensely hyper-local. A property located two miles north of an interstate interchange may experience thriving industrial absorption, while an identical property three miles south struggles with chronic vacancy due to municipal weight restrictions or rail bottlenecks. The presentation must prove micro-location superiority using third-party econometric data (CoStar, CBRE EA, Green Street, Esri, and U.S. Census Bureau).
1. Competitive Delivery Pipeline vs. Historical Net Absorption. The deck must feature an empirical supply/demand balance slide. Show the trailing 5-year historical annual net absorption across the specific submarket compared against: (a) Properties currently under construction, (b) Properties undergoing site plan approval, and (c) Properties in rezoning. Calculate the 'Submarket Inventory Expansion Ratio' (Total Upcoming Deliveries divided by Existing Total Submarket Stock). If a submarket contains 10 million SF and has 1.5 million SF under construction (a 15% expansion), the sponsor must prove that annual net absorption can absorb this inventory within 18 months without eroding asking rents or inflating leasing concessions.
2. Micro-Demographics and Economic Demand Drivers. For multifamily and retail assets, present demographic heatmaps detailing 1-mile, 3-mile, and 5-mile radiuses. Key indicators include: Median Household Income ($MHI >= $85,000 for Class A multifamily; >= $110,000 for grocery-anchored retail), 5-year projected population growth rate, and Rent-to-Income Ratios (proving that average underwritten monthly rents do not exceed 28% to 30% of local gross household earnings). Highlight major corporate employers, regional medical centers, university campuses, or logistics hubs that provide resilient, diversified employment bases.
3. Physical Barriers to Entry & Land Entitlement Constraints. Top presentations explain why competitors cannot easily duplicate the subject property. Detail local zoning constraints, natural geographical boundaries (waterways, protected greenbelts, topography), municipal water/sewer utility moratoriums, or exorbitant development impact fees that establish a defensive economic moat around the asset.
Exhibit 4: Submarket Demographic & Supply-Demand Fundamentals Dashboard
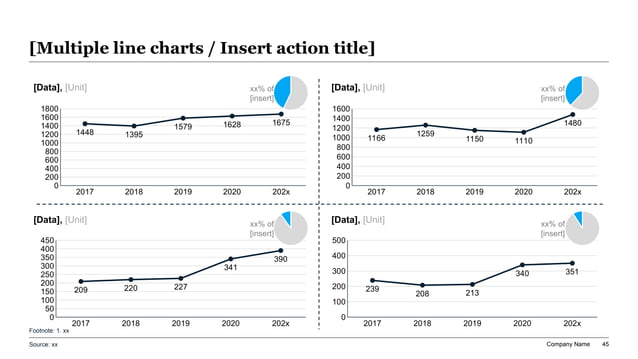
Table 2: Value-Add Capital Expenditure Budget & Return-on-Cost (ROC) Schedule
Comprehensive capital improvement expenditure budget, per-unit/per-sqft allocations, targeted monthly rent premiums, and incremental return on invested capital for a representative 240-unit Class B to Class A- multifamily repositioning.
| Improvement Category | Scope of Work & Specifications | Total Budget ($) | Cost Per Unit / Sq Ft | Target Monthly Premium | Unlevered Return on Cost (%) |
|---|---|---|---|---|---|
| Full Unit Interior Modernization (180 Units) | Quartz countertops, undermount stainless sinks, shaker-style cabinetry, luxury vinyl plank (LVP) flooring, tile backsplashes, designer plumbing fixtures, and smart thermostat/keyless lock packages. | $2,160,000 | $12,000 / unit | +$225 / month per unit | 22.5% Return on Cost ($2,700 annual premium / $12,000 CapEx) |
| Light Unit Refresh (60 Units) | Cabinet repainting, brushed nickel hardware upgrades, designer light fixtures, two-tone interior paint, and framed bathroom mirrors for units with existing modern flooring. | $270,000 | $4,500 / unit | +$95 / month per unit | 25.3% Return on Cost ($1,140 annual premium / $4,500 CapEx) |
| Clubhouse, Fitness Center & Co-Working Lounge | Complete expansion and modern redesign of resident clubhouse, commercial-grade fitness facility (Peloton, squat racks), and private micro-offices with high-speed fiber for remote professionals. | $550,000 | $2,292 / unit (spread across 240 units) | +$35 / month property-wide renewal lift | 18.3% Return on Cost ($100,800 annual revenue / $550,000 CapEx) |
| Resort Pool, Outdoor Kitchen & Dog Park | Pool resurfacing, modern cabanas with charging stations, dual stainless outdoor grilling stations, pet agility course, and synthetic turf pet relief station. | $380,000 | $1,583 / unit (spread across 240 units) | +$25 / month property-wide amenity fee | 18.9% Return on Cost ($72,000 annual amenity fees / $380,000 CapEx) |
| Building Exterior, Roofs & Energy Efficiency Retrofit | Full exterior pressure wash and contemporary paint scheme, partial roof replacements with 20-year TPO warranties, high-efficiency LED site lighting, and smart irrigation flow controllers. | $720,000 | $3,000 / unit | +$58,000 annual OpEx savings (utility/insurance) | 8.1% Direct OpEx Reduction + Capital Preservation |
| Total Value-Add Capital Program | Complete 24-month property repositioning plan transforming Class B asset into premier Class A- community in high-growth suburban submarket. | $4,080,000 | $17,000 / unit (total basis) | +$684,000 Net Annual Incremental NOI | 16.76% Blended Unlevered Return on Capital Invested |
Value-Add Execution & Business Plan Phasing: Avoiding Operational Disruption and Cost Overruns
In Value-Add commercial real estate investing, generating alpha depends entirely on execution velocity. A delayed renovation schedule burns carry costs, inflates interest expense during bridge loan tenures, and risks missing peak spring and summer leasing seasons. The investment deck must demonstrate that the sponsor's operational execution plan is as sophisticated as their financial modeling.
1. Off-Line Vacancy Staging & Unit Turn Mechanics. An Investment Committee will immediately penalize a pro forma that assumes 50 units can be renovated simultaneously without sacrificing in-place property cash flow. The presentation must detail a disciplined renovation staging cadence: capping off-line units at 8 to 12 units per month (3% to 5% of property inventory). Unit renovations should be executed within a strict 18-to-21 business day turnaround cycle upon lease expiration, supported by pre-purchased bulk materials warehoused on-site to eliminate supply chain delivery bottlenecks.
2. Contractual Price Guarantees & General Contractor Vetting. To mitigate construction risk, top sponsors present executed Guaranteed Maximum Price (GMP) contracts or formal contractor bid tabulations from at least three licensed, insured commercial general contractors. Highlight the contractor's historical performance, bonding capacity, and warranty terms (1-year comprehensive contractor workmanship warranty, 10-year manufacturer structural/roof warranties).
3. Real-Time Rent Premium Testing and Absorption Proving. If the sponsor has already executed a 'proof-of-concept' model unit during the pre-acquisition inspection contingency period, feature photographs and actual signed lease agreements. Showing that prospective tenants willingly paid a $225 monthly premium for a renovated test unit during diligence converts speculative pro forma assumptions into indisputable investment proof.
The Capital Stack: Structuring Senior Debt, Mezzanine Financing, and Equity Tranches
How a deal is capitalized dictates both the magnitude of limited partner returns and the vulnerability of the asset during economic downturns. A professional CRE pitch deck provides complete transparency regarding the capital structure, detailing every layer of the capital stack from senior mortgage liens down to general partner co-investment equity.
1. Senior Mortgage Debt Profiling. Clearly articulate the senior loan structure: Lender Category (Agency Fannie Mae/Freddie Mac, Life Insurance Company, Balance Sheet Commercial Bank, Debt Fund, or CMBS conduit). Key loan terms must be displayed in a dedicated term sheet summary table: Total Loan Commitment, Initial Advance, Future Funding Facility (earmarked for CapEx disbursements), Loan-to-Value (LTV <= 65% for Core/Core-Plus; <= 75% Loan-to-Cost for Value-Add), Interest Rate Structure (Fixed-rate coupon vs. Floating-rate SOFR spread), Term Length (5, 7, or 10 years), Interest-Only (I/O) Period (e.g., 24 to 36 months during renovation), and Amortization Schedule (typically 30-year schedule thereafter).
2. Interest Rate Risk Hedging & Covenants. In volatile monetary environments, floating-rate bridge debt without structural hedging is unacceptable to institutional equity. Decks must specify the mandatory Interest Rate Cap: strike price (e.g., 1-month term SOFR capped at 4.50%), term duration (2 to 3 years matching the initial loan term), pre-funded interest rate escrow reserves, and provider rating (A/A2 or higher). Detail all contractual bank covenants, including minimum Debt Service Coverage Ratio (DSCR) covenants, Debt Yield hurdles required to qualify for future loan extension options, and liquidity covenants imposed on the sponsor guarantor.
3. Mezzanine Debt vs. Preferred Equity Structuring. When a capital stack utilizes subordinate debt to bridge the gap between 65% senior LTV and 80% total leverage, detail the intercreditor mechanics: Coupon structure (e.g., 11.5% total yield with 8.0% current-pay cash coupon plus 3.5% payment-in-kind / PIK interest compounding monthly), maturity date, cure rights, and intercreditor standstill provisions governing mortgage defaults.
4. Equity Capitalization & Sponsor Co-Investment ('Skin in the Game'). Limited partners demand alignment of interest. Clearly display the equity capitalization breakdown: LP Equity Contribution (typically 90% to 98% of total equity) and General Partner (GP) Co-Investment (2% to 10% of total equity). An Investment Committee gains immense confidence when the sponsor co-invests substantial, balance-sheet-derived cash alongside the LP, proving that the sponsor faces true downside risk if the business plan falters.
Table 3: Multi-Scenario Exit Cap Rate & Terminal NOI Sensitivity Matrix
Dual-variable sensitivity grid modeling 5-year holding period Net Levered Internal Rate of Return (IRR) and Equity Multiple (MOIC) across five exit capitalization rate shifts and three terminal Net Operating Income (NOI) performance cases.
| Exit Cap Rate Scenario | Terminal NOI: Downside (-5%) | Terminal NOI: Base Underwriting ($3.42M) | Terminal NOI: Upside (+5%) | Levered IRR Range (%) | Equity Multiple (MOIC) |
|---|---|---|---|---|---|
| Compression (-50 bps / 5.25% Cap Rate) | 18.9% IRR / 2.15x MOIC | 20.8% IRR / 2.32x MOIC | 22.6% IRR / 2.49x MOIC | 18.9% - 22.6% | 2.15x - 2.49x |
| Mild Compression (-25 bps / 5.50% Cap Rate) | 17.4% IRR / 2.01x MOIC | 19.2% IRR / 2.16x MOIC | 20.9% IRR / 2.31x MOIC | 17.4% - 20.9% | 2.01x - 2.31x |
| Flat to Market Exit (Base Case / 5.75% Cap Rate) | 15.8% IRR / 1.87x MOIC | 17.5% IRR / 2.02x MOIC | 19.1% IRR / 2.15x MOIC | 15.8% - 19.1% | 1.87x - 2.15x |
| Expansion (+25 bps / 6.00% Cap Rate) | 14.2% IRR / 1.74x MOIC | 15.9% IRR / 1.88x MOIC | 17.4% IRR / 2.00x MOIC | 14.2% - 17.4% | 1.74x - 2.00x |
| Severe Stress Expansion (+75 bps / 6.50% Cap Rate) | 11.1% IRR / 1.51x MOIC | 12.6% IRR / 1.63x MOIC | 14.0% IRR / 1.73x MOIC | 11.1% - 14.0% | 1.51x - 1.73x |
Exhibit 5: Risk-Adjusted Return & Value-Add Exit Sensitivity Matrix
LP/GP Distribution Waterfalls: Structuring Hurdle Rates, Catch-Ups, and Carried Interest
The distribution waterfall dictates the precise mathematical sequence by which distributable operating cash flows and capital transaction proceeds (refinancing and sale) are apportioned between Limited Partners (capital providers) and General Partners (sponsors). Institutional presentations must clearly define the waterfall structure, eliminating ambiguity regarding promote hurdles, compounding frequencies, and clawback guarantees.
1. European vs. American Waterfall Architecture. Institutional investors overwhelmingly demand European (Whole-Fund / Full-Return-of-Capital-First) waterfalls for institutional private funds, where 100% of all cash flows are distributed to investors until they have received a 100% return of their invested equity capital plus their accrued preferred return. For single-asset syndicated deals, American (Deal-by-Deal) waterfalls are common, where operating cash flows and disposition proceeds are distributed simultaneously according to tiered hurdle tiers, backed by an institutional GP Clawback agreement.
2. Multi-Tiered Hurdle Mechanics and Carried Interest Splits. A standard institutional private real estate waterfall follows a four-tier hurdle structure:
• Tier 1 (Preferred Return): 100% of all available cash flow is distributed to limited partners and the general partner pari passu in proportion to their initial equity contributions until investors achieve an agreed annual preferred return (typically 8.0% cumulative compounding annual return). The GP receives zero carried interest promote during this tier.
• Tier 2 (First Promote Hurdle - 8.0% to 12.0% Levered IRR): After the 8.0% preferred return is satisfied, remaining cash flows are split 80% to Limited Partners and 20% to the General Partner as carried interest promote.
• Tier 3 (Secondary Promote Hurdle - 12.0% to 15.0% Levered IRR): As returns accelerate through successful operational value creation, cash flows are split 70% to Limited Partners and 30% to the General Partner.
• Tier 4 (Super-Promote Hurdle - Above 15.0% Levered IRR): For outsized performance exceeding a 15.0% IRR, residual distributions are split 50% to Limited Partners and 50% to the General Partner, highly incentivizing the sponsor to maximize exit valuation.
3. GP Catch-Up Provisions and Clawback Protections. Detail whether the waterfall includes a GP Catch-Up clause (enabling the GP to receive 50% to 100% of distributions post-preferred-return until their aggregate profit share matches their target promote tier). Crucially, institutional LPs require an auditable GP Clawback Provision, mandating that if final fund liquidations reveal the sponsor received cumulative carried interest exceeding their contractual share, the GP must promptly return excess distributions to the partnership escrow.
Checklist 2: Investment Committee Pre-Closing Presentation Verification
AI Prompt Recipe: Generating Institutional CRE Pitch Decks with XLSlides
Role: Institutional Commercial Real Estate Private Equity (REPE) Acquisitions Vice President
Why Real Estate Investment Teams Build Commercial Decks with XLSlides
In institutional commercial real estate, acquisitions teams and private equity analysts spend hundreds of hours each quarter manually converting complex financial models from Excel and Argus into PowerPoint presentations. The traditional workflow is notoriously inefficient: taking manual screenshots of Excel tables that blur when scaled on boardroom monitors, retyping numbers across slide iterations, and repairing broken formatting whenever an underwriting assumption changes during diligence negotiations.
Generic AI presentation makers cannot solve this challenge because they lack native comprehension of financial underwriting mechanics. Consumer presentation tools hallucinate random bullet points, omit critical debt covenants, and cannot parse complex multi-sheet pro forma cash flow models.
XLSlides is engineered specifically for serious corporate finance and private equity workflows:
1. Direct Pro Forma and Spreadsheet Ingestion: XLSlides natively ingests complex real estate financial spreadsheets, Argus cash flow exports, and rent roll schedules. It extracts underlying data arrays and transforms them into crisp, mathematically verified PowerPoint waterfall charts, debt yield dashboards, and sensitivity tables without loss of resolution.
2. Institutional Consulting & Investment Aesthetics: XLSlides applies battle-tested visual hierarchy derived from top private equity funds and strategy firms: clean typography, clear section dividing architectures, structured 2-panel executive summaries, and distinct Harvey Ball qualitative matrices. Decks look like they were produced by a top-tier Wall Street investment bank or institutional REPE acquisitions team.
3. 100% Editable Native PowerPoint Output: Unlike web-based slide software that locks presentations inside proprietary cloud sandboxes, XLSlides exports fully editable Microsoft PowerPoint (.pptx) files. Deal teams retain total freedom to fine-tune vector chart geometries, modify text copy, and apply customized institutional firm branding before walking into confidential Investment Committee reviews.
Frequently Asked Questions: Mastering Commercial Real Estate Investment Decks
What is the standard slide count for a commercial real estate pitch deck?
An institutional commercial real estate investment pitch deck typically contains 20 to 28 slides for the main presentation, accompanied by an appendix of 10 to 20 slides. The core deck focuses strictly on executive decision drivers: acquisition thesis, asset physical specs, submarket supply/demand dynamics, pro forma NOI waterfall, value-add CapEx budget, debt terms, waterfall distributions, and sensitivity analysis. Granular lease contracts, environmental Phase I executive summaries, engineering structural reports, and full 10-year monthly Argus schedules are housed in the appendix for reference during committee Q&A.
How should sponsors present negative historical NOI or high vacancy in a Value-Add pitch?
Never attempt to disguise historical operational distress. Institutional investors respect transparency. Present historical operational underperformance as the primary investment thesis: explain why the asset underperformed under prior ownership (e.g., absentee management, lack of capital reinvestment, below-market legacy family leases, or inefficient on-site payroll). Then, present a quantitative 'Bridge from Trailing-12 Distress to Stabilized Operations', showing the exact step-by-step operational fixes (management overhaul, professional leasing brokerage, unit interior renovations, and utility bill-back programs) that restore the property to market-standard Net Operating Income.
What is the difference between an In-Place Cap Rate and a Stabilized Yield-on-Cost?
The In-Place Cap Rate (or Going-In Cap Rate) reflects the property's trailing 12-month net operating income divided strictly by the initial purchase price before transaction costs or renovation expenses ($T12 NOI / Purchase Price$). It reflects current unadjusted cash flow. The Stabilized Yield-on-Cost (Return on Cost / ROC) reflects the projected stabilized Net Operating Income (achieved after renovations, re-tenanting, and operational fixes) divided by the total capital invested in the deal ($Stabilized NOI / [Purchase Price + Transaction Costs + Total CapEx]$). A successful Value-Add acquisition typically targets a Stabilized Yield-on-Cost at least 125 to 200 basis points higher than prevailing market exit cap rates, proving adequate compensation for execution risk.
Why do institutional Investment Committees scrutinize Debt Yield more than DSCR in high-rate environments?
Debt Service Coverage Ratio (DSCR) is sensitive to artificial financing terms: a sponsor can artificially inflate DSCR by negotiating an interest-only period, securing a longer 35-year amortization schedule, or buying down interest rates with upfront fees. In contrast, Debt Yield ($NOI / Loan Principal Balance$) is an unadulterated measure of collateral cash flow support completely independent of interest rates, amortization, or loan structures. It tells the lender and LP exactly what cash return the lender would earn on its capital if it had to foreclose on the property and operate it directly tomorrow. In modern debt markets, lenders require a minimum 9.0% to 10.5% debt yield to refinance or extend bridge loans.
How should co-tenancy and dark store risks be documented in retail CRE presentations?
In retail commercial real estate (power centers, grocery-anchored strip centers, lifestyle malls), co-tenancy clauses present major downside liabilities. If an anchor tenant (e.g., Target, Kroger, or Kohl's) vacates or 'goes dark' (continues paying base rent but ceases retail operations), surrounding in-line tenants may possess contractual rights to reduce rent to 50% or terminate leases within 6 to 12 months. The presentation must feature a dedicated 'Tenant Lease Risk Matrix' identifying all existing co-tenancy provisions, historical anchor sales volumes proving anchor profitability, and the sponsor's mitigation strategy (e.g., pre-negotiated re-tenanting replacement lists, pre-funded escrow reserves, and low debt leverage).
Can AI tools like XLSlides accurately translate complex Excel underwriting models into PowerPoint slides?
Yes, provided the AI tool is specifically architected for structured corporate finance data rather than generic text generation. XLSlides parses complex financial tables, Argus outputs, and debt structures, mapping them directly into standardized consulting chart components: waterfall bridges, stacked lease expiration bars, multi-scenario sensitivity tables, and split-panel deal summaries. Crucially, XLSlides generates native, editable PowerPoint (.pptx) slides rather than static raster images, enabling investment analysts and acquisitions associates to adjust numbers, fine-tune assumptions, and align styles directly inside Microsoft PowerPoint.
Generate Institutional Commercial Real Estate Pitch Decks in Minutes
Transform complex real estate pro formas, rent rolls, and value-add business plans into boardroom-ready PowerPoint presentations with institutional logic, action titles, and editable vector charts.
Methodology And Sources
- Emerging Trends in Real Estate 2026: Institutional Underwriting Benchmarks and Capital Markets Dynamics(PwC & Urban Land Institute (ULI) • 2026)
Benchmark research detailing institutional capitalization rate spreads, debt yield underwriting hurdles, and replacement cost economics across primary and secondary metropolitan statistical areas (MSAs).
- Institutional Real Estate Underwriting Guidelines & Pro Forma Cash Flow Modeling Standards(NAIOP Commercial Real Estate Development Association • 2025)
Standardized methodology for commercial pro forma cash flow modeling, lease rollover risk grading, debt service coverage ratio (DSCR) calculations, and capital expenditure amortization.
- Commercial Property Market Outlook: Capital Markets & Yield-on-Cost Spread Dynamics(CBRE Econometric Advisors & Capital Markets Research • 2026)
Empirical market study analyzing industrial, multifamily, and retail asset pricing, exit cap rate expansion sensitivities, and debt syndicate covenants.
- Private Real Estate Investment Analysis, Distribution Waterfalls, and Attribution Methodologies(CFA Institute • 2025)
Core institutional corporate finance framework governing European vs. American distribution waterfalls, preferred returns, GP promote hurdles, and capital account reconciliations.
- Nareit Total REIT Industry Tracker (T-Tracker): Historical Cap Rates, NOI Growth & Leverage Metrics(National Association of Real Estate Investment Trusts (Nareit) • 2026)
Longitudinal data series tracking public-market and private-market commercial property Net Operating Income (NOI) growth, debt yields, and occupancy trends across property sectors.