Retail Growth Strategy & Omnichannel Presentation Template

Stop wasting hours on manual formatting. Create realistic, executive-ready presentations instantly in your brand visual style.

Store performance dashboards
Omnichannel expansion frameworks
BCG growth-share matrix layouts

1What is the Retail Growth Strategy Presentation?

The Retail Growth Strategy presentation is a high-fidelity visual architecture designed to translate complex retail expansion plans, omnichannel integration roadmaps, and business portfolio metrics into highly persuasive, C-suite narratives. In modern consumer-facing ecosystems, a retail growth deck is a critical strategic instrument used by retail executives, brand managers, and strategy leads to align physical store footprints with rapid digital expansion. Rather than relying on generic, low-density slides that dilute executive focus, this boardroom-ready template enforces absolute logical progression, moving institutional investors, lenders, and directors from abstract retail theories to concrete market share execution. By establishing a gold standard of visual excellence, this presentation guarantees that your market positioning, geographic rollouts, and customer loyalty frameworks are communicated with complete professional authority. This comprehensive structure ensures that all stakeholders, from regional operations directors to capital committees, understand the exact investment rationale, driving strategic buy-in and funding velocity. This operational alignment eliminates friction, paving the way for rapid store-level profitability.
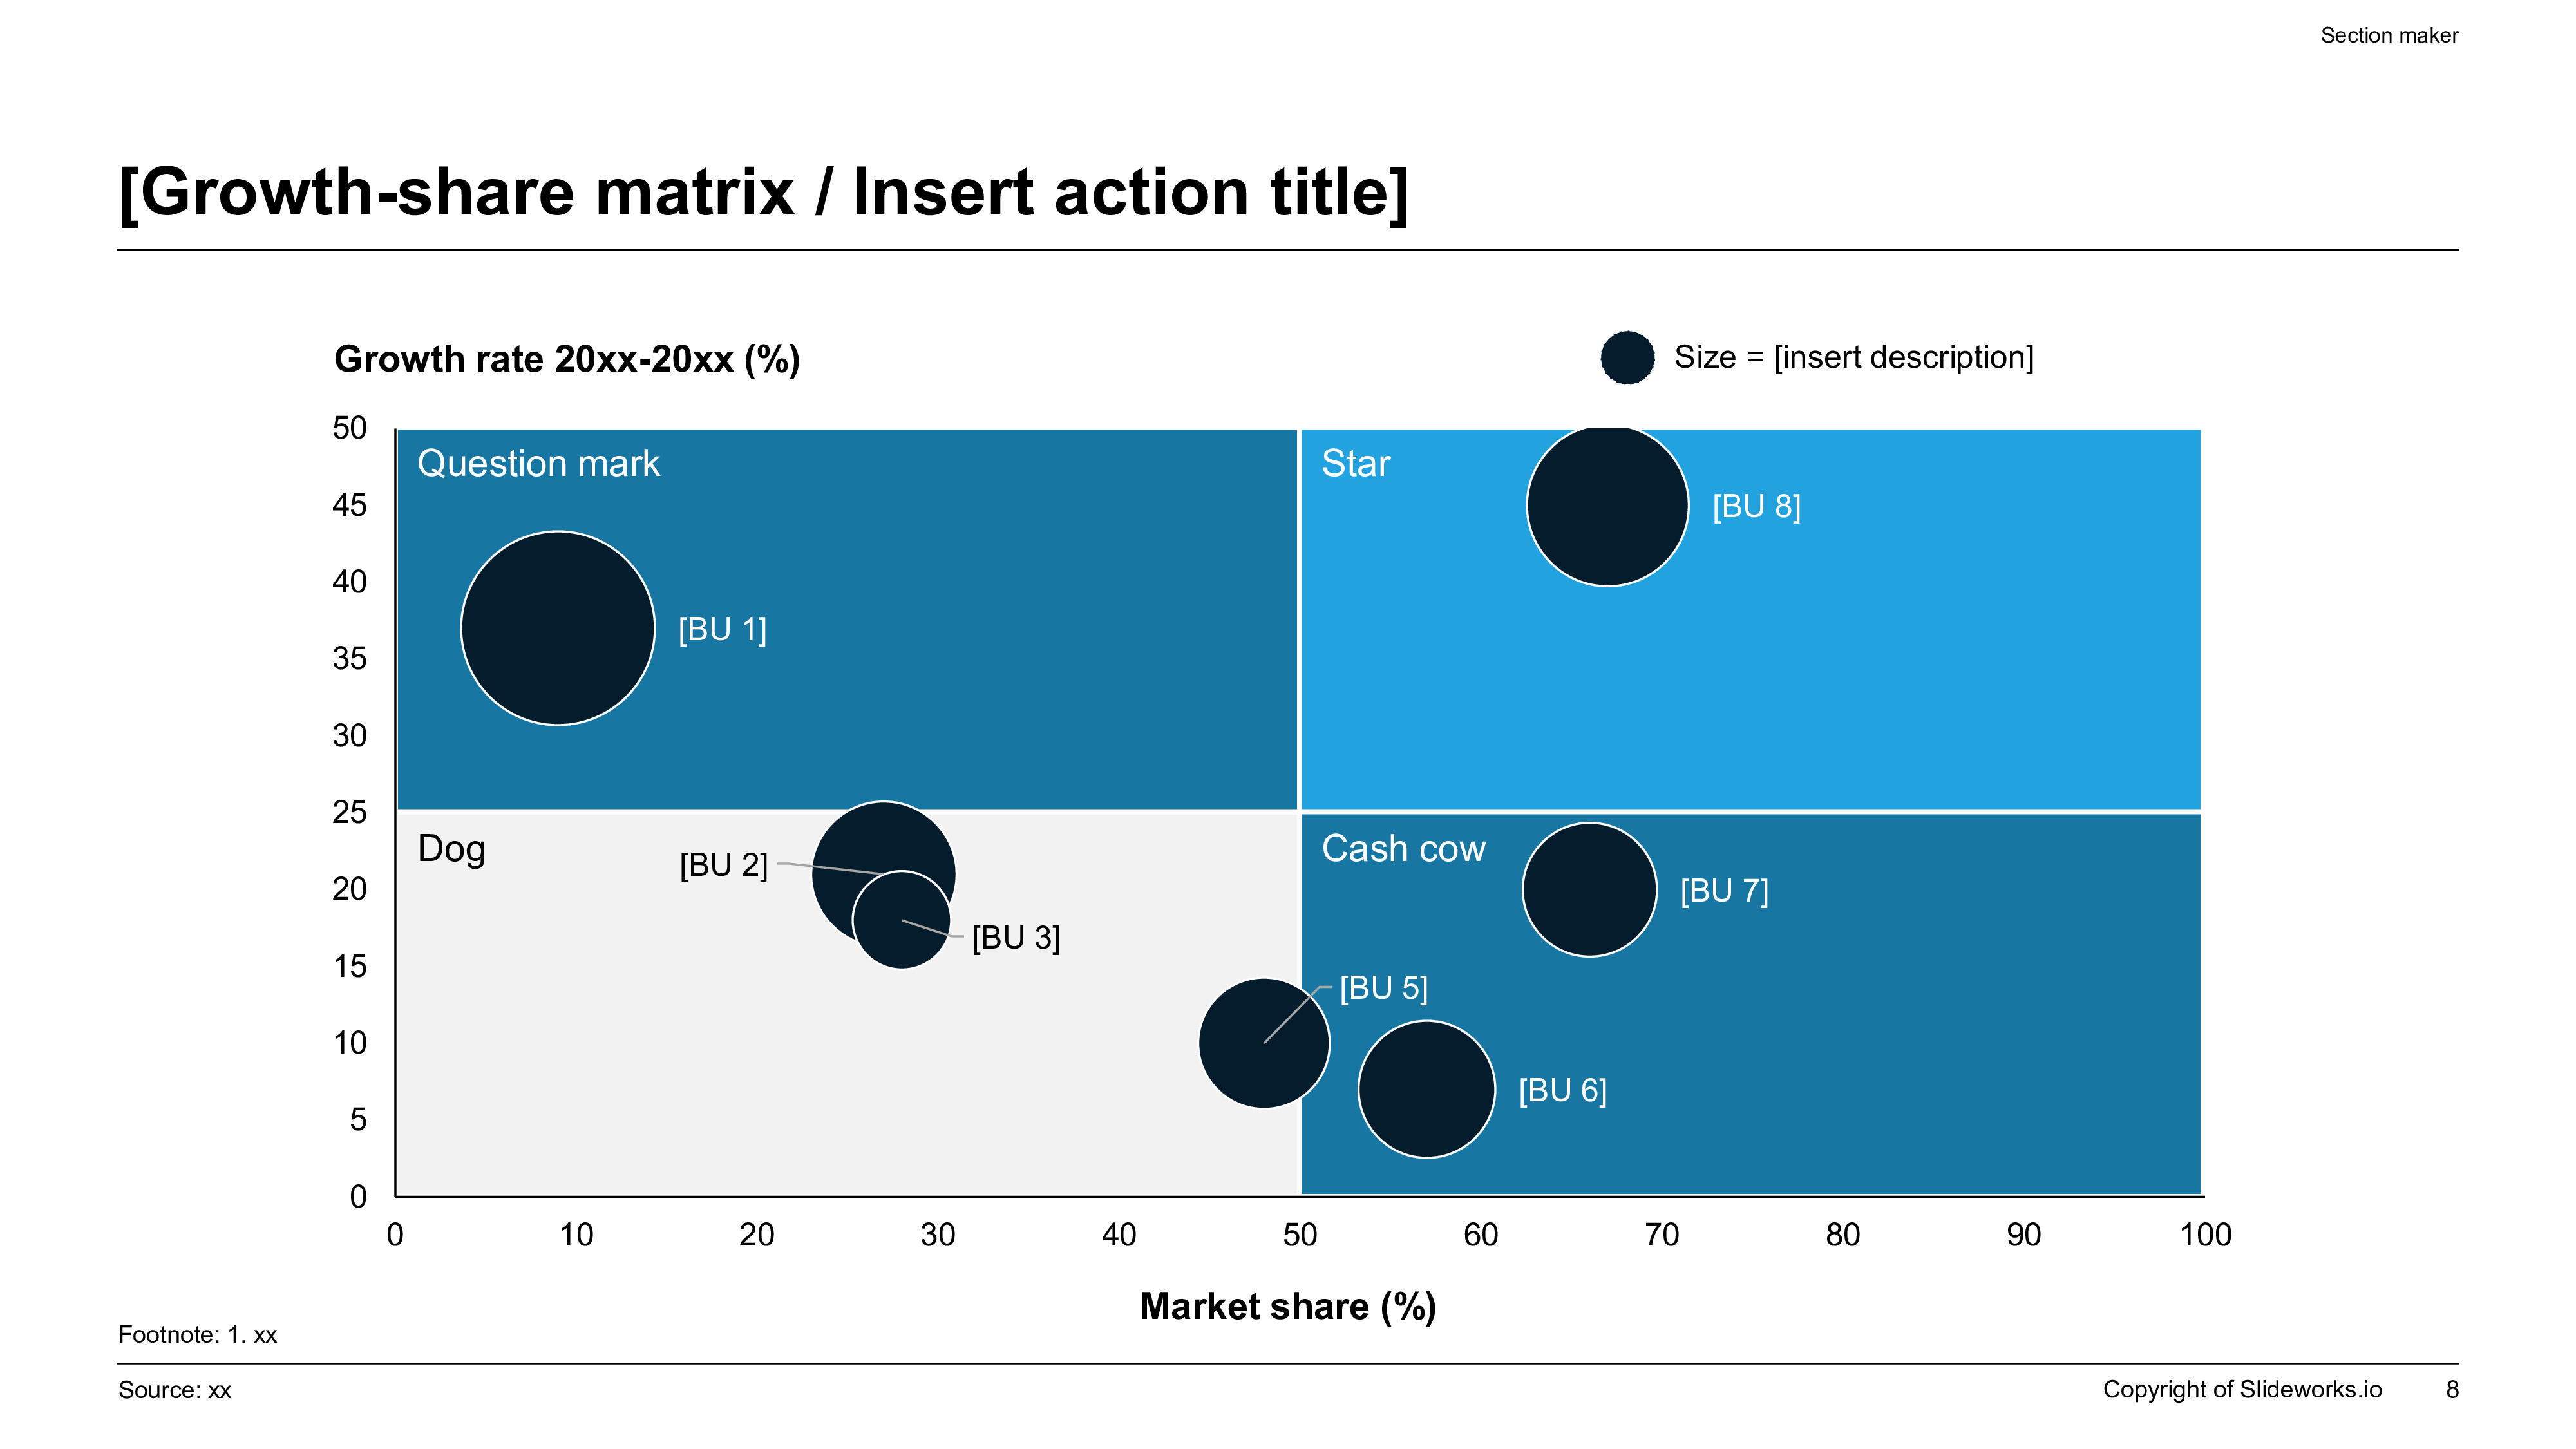
A widescreen 16:9 BCG Growth-Share Matrix consulting slide featuring a color-coded quadrant grid with labeled Question Mark, Star, Dog, and Cash Cow business units.
Template Design LayoutRetail Growth Strategy & Omnichannel Presentation Template

2Ideal Audience: Who is this retail template built for?

This premium presentation template is explicitly engineered for high-intent retail professionals, strategy directors, and consumer brand executives who present to corporate boards, private equity investors, bank lenders, or retail landlords. The primary user groups include Chief Operating Officers (COOs) optimizing brick-and-mortar networks, VP of E-commerce scaling digital footprints, Retail Strategy Consultants pitching growth diagnostics, and Brand Directors launching new retail categories. These leaders operate in margin-sensitive environments where presenting an unpolished or mathematically inconsistent presentation is a severe risk. Utilizing this template removes visual debt and alignment drift, enabling solo retail entrepreneurs and global multi-brand conglomerates alike to focus entirely on core business logic and inventory performance. This deck provides the exact analytical rigor and spatial grid expected by C-suite executives, institutional lenders, and lease committees, establishing immediate operational trust and competence. Every layout and margin is calibrated to deliver the elite standard expected by global retail allocators. It bridges the gap between brick-and-mortar strategy and digital commerce scaling.

3Practical Use Cases: When and where to deploy retail growth slides

The strategic utility of the Retail Growth Strategy framework applies directly to major business milestones and corporate cycles within the retail industry. Key deployment scenarios include quarterly board meetings, brick-and-mortar expansion business cases, e-commerce roadmap alignments, and venture capital or private equity funding pitches. During major board reviews, this deck is deployed to showcase store-level performance, margins, and omnichannel ROI metrics with visual authority. For geographic rollouts, it serves to coordinate market entry schedules, demographic demand analysis, and municipal permitting timelines for real estate committees. In digital transformation scenarios, the template maps e-commerce funnel conversion, warehouse logistics integration, and customer lifetime value metrics. Deploying this structured layout ensures your retail stakeholders receive data in the exact format they expect, maximizing comprehension and strategic retention during high-stakes investment negotiations, while serving as a formal corporate record that anchors all future partnership agreements, driving significant operational momentum across your entire retail network. This provides a continuous roadmap for sustained retail expansion.

4Structural Blueprint: Recommended 10-Slide Narrative Outline

A complete, boardroom-ready Retail Growth Strategy presentation must follow a logical, narrative-driven 10-slide outline to guide institutional partners from market thesis to execution milestones:

  • Slide 1: Executive Title & Thesis** — Establishing the core growth opportunity and market targets.
  • Slide 2: Omnichannel Customer Journey** — Mapping customer interactions across digital and physical touchpoints.
  • Slide 3: Store Footprint Expansion** — Visualizing regional store expansions and demographic penetration.
  • Slide 4: Operations & Supply Chain** — Detailing warehousing, logistics, and inventory velocity.
  • Slide 5: E-commerce Funnel Metrics** — Outlining digital acquisition, conversion, and customer acquisition costs.
  • Slide 6: BCG Growth-Share Matrix** — Structuring retail products or store categories by growth potential.
  • Slide 7: Customer Loyalty Program** — Defining customer retention strategies and average order value.
  • Slide 8: Financial Projections & CAPEX** — Detailing investment budgets and five-year revenue projections.
  • Slide 9: Risk Mitigation Framework** — Identifying supply chain vulnerabilities and competitor responses.
  • Slide 10: Call to Action & Timeline** — Enforcing immediate execution steps and strategic milestones.

Following this comprehensive ten-slide progression guarantees that your retail audience remains engaged, understands the logical connections between digital and physical strategies, and receives all the necessary analytical evidence to approve your growth plan with absolute confidence.

5Aesthetics & Design Rationale of the mckinsey-blue Theme

Our specialized retail growth presentation template leverages a premium 'mckinsey-blue' consulting design system designed to satisfy the strict expectations of executive boards and private equity firms. The visual architecture utilizes a dominant professional navy blue tone (60%), a high-contrast clean container structure (30%), and a vibrant corporate gold or teal accent (10%) to guide executive attention precisely to key growth metrics, store expansion timelines, or financial pro-formas. Widescreen 16:9 layout boundaries keep the narrative clean and structured, ensuring visual excellence across all projectors and digital screens. A crucial design rule is preserving at least 30% negative space on every layout card, which prevents cognitive friction and visual clutter. This ensures that the client's attention is focused precisely on critical data points, consumer trends, and omnichannel performance rather than being distracted by unnecessary decorations. The aesthetic projects organizational discipline, operational competence, and supreme attention to detail, easily passing institutional due diligence standards. It provides the perfect visual foundation for retail success.

6Integrating the BCG Growth-Share Matrix Framework

To establish deep topical authority and pass rigorous retail investor scrutiny, you must structure your presentation around recognized strategic business frameworks. This template integrates the legendary BCG Growth-Share Matrix as its primary analytical centerpiece. The framework categorizes your retail business units, product categories, or geographic store networks into four distinct quadrants based on market growth rate and relative market share:

  • Stars**: High growth, high market share business units (such as your newly launched organic cosmetics line or high-traffic flagship urban stores) that require sustained capital reinvestment.
  • Cash Cows**: Low growth, high market share sectors (such as mature brick-and-mortar departments or established private label lines) that generate strong, consistent free cash flows to fund expansion elsewhere.
  • Question Marks**: High growth, low market share ventures (such as experimental social-commerce initiatives or new regional pilots) that require intensive evaluation and capital prioritization.
  • Dogs**: Low growth, low market share segments that drain operational energy and are prime candidates for structural divestment.

Leveraging this framework proves to your board and private equity partners that your capital allocation is driven by objective, structured market dynamics.

7Omnichannel Growth Strategy and Customer Experience Frameworks

In modern retail, scaling requires a seamless integration of digital and physical touchpoints to deliver a consistent customer experience. This template provides specialized visual layouts designed to articulate omnichannel strategy frameworks, mapping out customer pathways from initial online discovery to store-level interactions (such as BOPIS — buy online, pick up in store, and store-to-home shipping). Strategies should incorporate the following operational focus areas:

  • Inventory Visibility**: Standardized process blocks illustrating real-time inventory synchronization across warehouses, e-commerce stores, and physical retail outlets.
  • Unified Loyalty Systems**: Detailed tables mapping data flows that integrate in-store point-of-sale transactions with digital customer loyalty accounts.
  • Conversion Optimization**: High-density checkout funnel steps mapping customer activation, average order value expansion, and churn reduction strategies.

By structuring these omni-channel frameworks within our professional grids, you present a clear, unified operational plan that highlights revenue synergies and proves system efficiency to institutional decision-makers, eliminating operational silos and accelerating commercial scaling. This structural approach provides a clear blueprint for brick-and-mortar brands transitioning into high-velocity digital retailers.

8Storylining and Narration via the Minto Pyramid Principle

Retail growth presentations often fail by overwhelming executive boards with raw, unstructured store-level transaction data. To prevent this, structure your growth strategy presentation using Barbara Minto's legendary Pyramid Principle. This communication standard requires three key rules:

  1. 1Lead with Conclusions First: Every slide title must be an active, conclusion-focused headline (e.g., use 'Omnichannel Integration Increases Customer Lifetime Value by 35%' rather than a passive label like 'Omnichannel Metrics').
  2. 2Logical Grouping: Ensure that your supporting slides represent a mutually exclusive, collectively exhaustive (MECE) set of arguments validating the main retail thesis.
  3. 3Widescreen Flow: Sequence your slides in structural, comparative, or chronological order to ensure a seamless narrative that keeps retail investors engaged.

By applying this structured narrative discipline, you eliminate data-dumping, allowing busy retail directors to grasp your entire strategic message in under 5 seconds per slide. This logical architecture guarantees that even if a stakeholder loses focus during dense financial projections, they can reorient themselves immediately. This structured narration drives boardroom consensus and accelerates capital allocation.

9Typography, Grids, and Boardroom Alignment Discipline

To keep your retail presentation looking like it was custom-made by a professional agency, you must enforce strict typographic and spatial boundaries in your presentation slides. First, maintain tight type scale discipline by limiting the deck to exactly two font families: headings must be kept at 24pt-28pt using a clean, modern serif or sans-serif font to convey authority, while body text must be 12pt-14pt to ensure complete legibility of small numbers and data tables. Second, all text blocks, metric cards, and charts must lock into a standard 12-column visual grid to prevent cognitive friction and visual drift. Third, contrast ratios must exceed 4.5:1 to guarantee optimal legibility on older boardroom projectors and mobile devices. Fourth, preserve at least 30% negative space on every layout card to let your core retail message breathe and improve cognitive processing. Respecting these typographical and alignment rules guarantees that your slide layouts communicate absolute visual authority, organizational discipline, and extreme attention to detail, easily passing institutional standards.

10Quantitative Performance Comparison: Manual Design vs. XLSlides AI

Below is a rigorous, quantitative performance analysis demonstrating why retail strategy executives, omnichannel operations directors, and consumer brand teams are transitioning away from manual PowerPoint slide creation to high-fidelity AI automation through the XLSlides platform:

Performance CriterionManual Slide CreationXLSlides AI Strategy Generation
Average Time Invested8 to 12 hours of draftingUnder 60 seconds total
Grid AlignmentManual eyeballed layoutsPerfect 12-column pixel grids
Brand Style LockoutProne to font and margin drift100% locked corporate style presets
Omnichannel LayoutsDrawn by hand from scratchReady-to-use vector components
Slide FormatsStandard legacy formatsHigh-fidelity 16:9 widescreen PPTX
Design Overhead CostsHigh agency hourly feesAffordable Pro subscription plans

Transitioning to this automated workflow represents an exceptional operational multiplier for retail operations. By eliminating design debt, it enables retail teams to dedicate their valuable time and cognitive focus to critical tasks such as inventory due diligence, regional market analysis, customer acquisition cost reduction, and physical store rollouts. It provides a modern, highly efficient alternative that ensures boardroom-ready visual excellence on every occasion, helping you secure capital faster and align global retail teams with absolute precision and clarity.