High-Impact Private Equity Thesis Templates

Stop wasting hours on manual formatting. Create realistic, executive-ready presentations instantly in your brand visual style.

Value creation lever frameworks
5-year exit strategy roadmaps
Distressed asset analysis

1What is a Private Equity Investment Thesis?

A Private Equity Investment Thesis is a highly structured, quantitative prospectus designed to detail an investment opportunity, corporate valuation metrics, post-acquisition leverage multipliers, and operational improvement roadmaps to fund investment committees and General Partners. In high-stakes institutional investing, a generic investment proposal is insufficient. Successful transaction sponsors require a clear, logical blueprint that demonstrates a deep understanding of target company financials and industry positioning. This presentation template translates messy transactional data, supplier networks, and complex LBO models into highly clear, professional, board-ready widescreen layouts. Structuring your investment thesis under this unified standard ensures that all investment committees, limited partners, and commercial banking underwriters receive critical metrics (such as historical CAGR, net working capital pegs, and enterprise multiples) in an elite corporate format. This eliminates frustrating design debt and lets dealmakers focus entirely on negotiating pricing structures, calculating returns, and securing financing, establishing a standard of absolute operational discipline, absolute clarity, and supreme professional authority. It provides a robust, institutional-grade narrative structure that immediately establishes commercial credibility with Limited Partners, allowing strategy teams to present comprehensive due diligence findings and value creation roadmaps with maximum strategic impact and minimal administrative overhead.
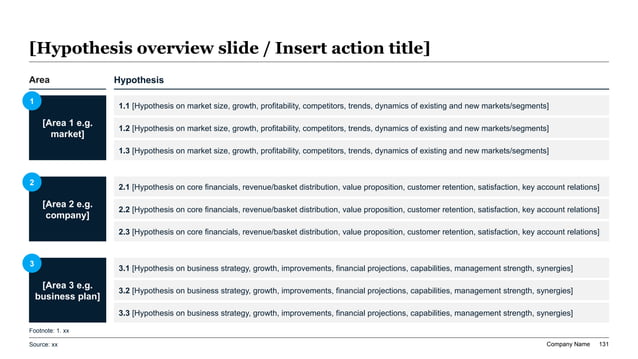
Private Equity strategic hypothesis slide featuring three vertical dark-blue badges with circular step numbers aligned with nine light-grey cards in a 16:9 layout.
Template Design LayoutHigh-Impact Private Equity Thesis Templates

2Audience & Use Cases: Who and When to Deploy This Deck

This premium slide template is explicitly engineered for investment professionals who must pitch buyouts, growth equity capital commitments, and distressed restructurings. The primary user profiles include private equity associates, LBO model analysts, managing directors, and emerging fund managers. These users operate in highly pressurized environments where submitting unverified data, poor slides, or inconsistent layouts can severely damage team credibility and lose capital backing. General partners deploy this presentation during Limited Partner (LP) fundraising roadshows, while associates use it to pitch specific buyout targets to internal investment committees. Beyond standard acquisitions, this deck is perfect for corporate development teams proposing mergers, secondary buyouts, or strategic corporate carve-outs. By locking fonts, container containers, and alignment rules, teams can prevent slide drift and maintain absolute brand consistency, communicating corporate discipline, operational competence, and extreme attention to detail to global partners and board underwriters. It is also perfect for securing strategic debt from commercial bank underwriters who require exhaustive balance sheet audits before approving credit facilities. Furthermore, it serves as an authoritative guide for strategy consultants, transition managers, and compliance officers who must align diverse stakeholders around operational timelines, regulatory milestones, and governance frameworks during integration phases.

3Aesthetics & Design Rationale of the mckinsey-blue Theme

The Private Equity presentation template leverages our specialized 'mckinsey-blue' design preset, engineered explicitly to project board-level authority, analytical depth, and structural gravity. The theme employs a dominant, professional deep corporate blue weight (10% accent color) combined with high-contrast neutral backgrounds (60% weight) and structured container elements (30% weight) to organize complex leverage details. Contrast ratios strictly exceed 4.5:1, ensuring optimal readability on boardroom projectors, tablet displays, and high-definition mobile screens. Widescreen 16:9 layout boundaries keep the narrative clean and structured, ensuring visual excellence across all projectors and digital screens. A crucial design rule is preserving at least 30% negative space on every layout card, which prevents cognitive friction and visual clutter. This ensures that the viewer's attention is focused precisely on critical data points, operational timelines, and logistics metrics rather than being distracted by unnecessary decorations. The aesthetic projects organizational discipline, technical precision, and supreme attention to detail, easily passing strict corporate and institutional due diligence standards. It represents a premium, boardroom-grade alternative to standard public layouts, allowing strategy teams to deliver visually stunning presentations that reassure capital partners and underwriting syndicates of the fund's professional standards and absolute precision.

4Applying the Minto Pyramid Principle to Private Equity Decks

Investment committees and strategy boards do not have time to wade through disorganized data dumps. To command authority and secure capital backing, structure your deal narrative around Barbara Minto's legendary Pyramid Principle. Under this elite communication standard, every single slide headline must serve as an active, key conclusion rather than a passive label. For example, instead of titling a slide 'Operational Improvement,' write an active headline like 'Our SG&A rationalization program is projected to increase EBITDA margins by 450 basis points by Year 3.' Every supporting detail, bullet point, or metric card must represent a MECE (Mutually Exclusive, Collectively Exhaustive) sub-argument that logically validates the main conclusion of that specific slide. Ideas must flow in chronological, structural, or comparative order to ensure a seamless widescreen narrative. This narrative discipline allows busy managing directors and investment partners to grasp your entire strategy in under 2 minutes, significantly accelerating operational trust and helping to align diverse deal teams on transaction terms and timeline. By enforcing this structured communication methodology across all presentation modules, you eliminate visual noise and cognitive drag, presenting your investment case with the absolute logical precision required to win backing in highly competitive market processes.

5Core Investment Frameworks: The LBO Model and Porter's Five Forces

To establish academic credibility and pass rigorous due diligence reviews, your private equity investment thesis presentation must incorporate recognized financial and operational frameworks. We recommend structuring your target company evaluation using Porter's Five Forces to analyze barrier to entry, supplier pricing power, and competitive rivalry, proving that the target possesses a defensible economic moat. Furthermore, presenters must detail the Leveraged Buyout (LBO) structure, visualizing how debt paydown and cash generation drive equity value creation over the holding period. Additionally, you should integrate the SCOR framework to highlight raw material sourcing efficiencies, proving that operational improvements are realistic and highly achievable. By leveraging these established strategic frameworks, deal leads prove to board committees and joint-venture partners that their investment recommendations are backed by rigorous quantitative modeling rather than vague operational guesses, validating the integrity of their strategic planning. This structured overview outlines the exact procedures for reporting potential security breaches, compliance violations, or workplace concerns. Integrating these models into your pitch ensures that institutional investors and bank credit committees can easily stress-test your assumptions, leading to faster credit approvals, higher debt capacity, and smoother execution timelines for complex transactions.

6Structural Blueprint: A 10-Slide Outline for Boardroom Pitches

A complete, boardroom-ready private equity investment thesis presentation must follow a logical, narrative-driven 10-slide progression to guide institutional partners from deal overview to final capital commitment:

- Slide 1: Executive Cover - High-impact project title and an active transaction thesis statement.

- Slide 2: Deal Overview & Context - Highlighting the primary target business, transaction size, and primary growth indicators.

- Slide 3: Target Market Dynamics - Analyzing sector growth, competitive advantages, and the target's economic moat.

- Slide 4: Financial Quality & EBITDA - Presenting historical revenue, gross margins, and normalized EBITDA adjustments.

- Slide 5: Value Creation Roadmap - Detailing operational improvement levers, cost synergies, and revenue expansion strategies.

- Slide 6: LBO Capital Structure - Visualizing the debt-equity mix, sources and uses of funds, and leverage ratios.

- Slide 7: 5-Year Exit Strategy - Mapping out secondary buyout options, strategic acquisitions, and IPO pathways.

- Slide 8: Detailed Risk Matrix - Identifying operational, legal, and financial risk severity levels and mitigation playbooks.

- Slide 9: Governance & Deal Team - Outlining board structures, management incentives, and deal partner backgrounds.

- Slide 10: Next Steps & Closing Timeline - An active call-to-action detailing capital calls, due diligence schedules, and closing dates.

Following this comprehensive and highly structured structural blueprint ensures that all underwriters, credit risk officers, and institutional partners receive a complete analytical picture of the acquisition with absolute clarity and zero narrative gaps.

7Quantitative Value Creation Levers: A 5-Year Operating Table

For deep-dive investment evaluations, presenting hard quantitative projections is essential. The following high-density data table outlines key operational performance targets and value creation levers across the proposed 5-year holding period, allowing administrators to demonstrate projected metrics relative to historical baseline indicators:

Operating ParameterYear 1 TargetYear 2 TargetYear 3 TargetYear 4 TargetYear 5 Exit Baseline
EBITDA Margin Improvement+150 bps+300 bps+450 bps+550 bps+600 bps
Debt Paydown Schedule$12.5M$25.0M$38.5M$52.0M$65.0M
Working Capital Optimization10.5% of sales9.8% of sales9.2% of sales8.8% of sales8.5% of sales
SG&A Overhead Reduction-8.5%-12.0%-15.5%-18.0%-20.0%
CAPEX Efficiency Multiple1.2x1.5x1.8x2.0x2.2x

Enforcing these baseline parameters within your underwriting models ensures that your operational plans remain realistic, fundable, and aligned with current regulatory and market preferences. By organizing this data in a structured, high-contrast matrix, you present complex quantitative relationships with supreme clarity. This enables investment associates and debt syndication leads to easily present post-acquisition financial scenarios, proving the sustainability of the transaction leverage and building absolute trust among credit underwriters and co-investors.

8Interactive Prototyping on the AI Visual Studio Canvas

This premium template integrates directly with the AI Visual Studio Canvas, our drag-and-drop reference workspace. To draft custom visual layouts, developers can click and drag anywhere on the 16:9 canvas area to draw custom text container placeholders, making layout drafting exceptionally visual. You can assign structural tags (such as metrics grid, column table, process timeline, or visual quote) to each drafted card to define the AI's rendering constraints. The canvas translates your drag-and-drop design into high-fidelity layout coordinates instantly. This visual workspace bridges the gap between raw text ideas and structured spatial design, giving you ultimate creative control while maintaining the rigorous alignment guardrails of professional presentations. To try it now, click the Open Interactive Canvas button in the sidebar or mobile stream to map out your slide layouts in real time, making custom presentation drafting exceptionally responsive, clear, highly visual, and perfectly aligned to your supply chain goals. This spatial drafting is perfect for showcasing specific physical spaces, financial timelines, and cash flows. It eliminates the frustration of manual pixel-tweaking and allows deal teams to quickly co-create visual outlines during active deal sprints, accelerating turnaround times and ensuring boardroom-ready layouts are compiled instantly and securely.

9Common Private Equity Pitch Mistakes to Exclude

To ensure your private equity investment thesis deck passes strict administrative and regulatory due diligence, avoid these 5 critical mistakes:

  • Finance Jargon Overload** - Slides are not financial manuals; if a slide contains dense technical papers, simplify it into high-impact takeaway cards and key charts for better visual clarity.
  • Unformatted Data Tables** - Describing complex debt structures with messy, unaligned lists; utilize strict, high-contrast comparison matrices showing clear trends.
  • Zero Visual Hierarchy** - Cramming too many metrics on a single slide; keep at least 30% white space to let the board focus on critical operations findings.
  • Low-Contrast Elements** - Using light gray or light blue text on white backgrounds, which washes out on older projectors; high-contrast coloring is mandatory.
  • Ignoring Risk Factors** - Failing to address operational failures, key-person dependencies, or leverage risks; declare regulatory milestones clearly to build institutional trust.

Avoiding these common design and pitching errors guarantees that your presentation retains board attention and builds trust across all transaction partners. By enforcing clean, high-contrast typography and structured content segments, your pitch deck maintains a sober, authoritative tone that reassures sophisticated allocators, credit rating agencies, and family offices of your organizational discipline and investment rigor.

10Quantitative ROI: Manual Slide Design vs. XLSlides AI Automation

Below is a quantitative comparison of manual PowerPoint drafting versus automated private equity slide generation:

  • Time Invested**: 10 to 15 hours of manual drafting versus under 60 seconds total with XLSlides AI.
  • Grid Alignment Precision**: Eyeballed manual layouts (prone to errors) versus automated, perfect 12-column pixel grids.
  • Brand Consistency**: Font and margin drift over time versus 100% lock to corporate style guides.
  • PowerPoint Compatibility**: Standard PPTX files that allow native Excel data and formula edits.
  • Framework Integration**: Hand-drawn financial charts versus built-in, ready-to-use template components.
  • Average Design Cost**: High designer hourly fees versus affordable, inclusive Pro plans.

Transitioning to automation represents a significant operational multiplier, ensuring investment planning excellence. It enables investment associates to concentrate their efforts on financial modeling, market due diligence, and deal negotiation rather than losing hours to frustrating formatting, offering a modern, highly efficient alternative for private equity leaders. By standardizing your presentation production on this automated platform, you ensure that every pitch, quarterly report, and investment memo meets the highest standard of visual excellence and analytical depth, driving deal velocity and raising fund limits.