Professional OKR Setting & Team Alignment Slide Templates

Stop wasting hours on manual formatting. Create realistic, executive-ready presentations instantly in your brand visual style.

Dynamic cascading alignment grids
Quantitative key result dashboards
Widescreen quarterly milestones

1Understanding OKR Setting & Team Alignment in Modern Strategy

The OKR (Objectives and Key Results) Setting & Team Alignment presentation is a rigorous strategic planning framework designed to translate high-level corporate vision into actionable, measurable execution paths. In complex business environments, the primary challenge is not merely defining the corporate strategy, but cascading that strategy across diverse, cross-functional organizational divisions without losing focus or alignment. This presentation serves as the central operational blueprint for C-suite executives, Chief Strategy Officers, and management consultants, providing a structured medium to communicate clear, qualitative objectives and their corresponding quantitative key results. Enforcing a strict logical hierarchy, an executive-ready OKR deck helps prevent organizational misalignment and formatting drift. It replaces passive, disconnected tracking spreadsheets with a cohesive narrative that links daily operations directly to the firm's overarching goals. By utilizing structured tables and visual cascade models, leadership teams can ensure that every department—from engineering to marketing—is aligned on key priorities, resource allocations, and timeline dependencies, thereby driving overall operational velocity and stakeholder alignment.
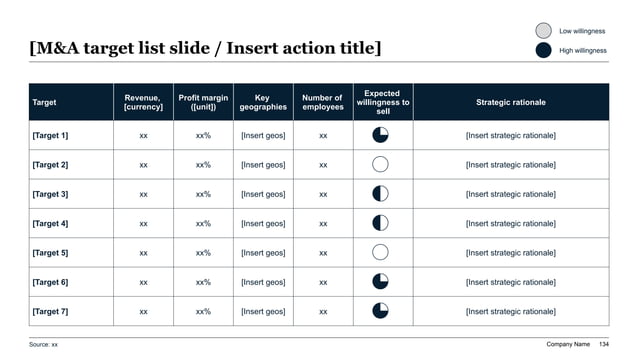
McKinsey-style OKR setting status table featuring a dark blue header banner over a 7-row matrix containing key results, team ownership, and Harvey Ball progress indicators.
Template Design LayoutProfessional OKR Setting & Team Alignment Slide Templates

2Ideal Corporate Audience: Who is this template built for?

This premium OKR alignment slide template is engineered for high-intent business professionals who lead strategic planning, execute operations, or advise corporate clients on performance management. The primary target demographics include Chief Strategy Officers (CSOs), VP of Strategy and Operations, Management Consultants, corporate development directors, and human resources executives. These leaders operate in high-density environments where presenting clear execution structures is vital to secure C-suite buy-in and board approval. Strategy teams and consultants deploy this deck to cascade company-wide objectives to business units, ensuring that performance metrics are framed with absolute rigor and clarity. Operational directors and agile coaches use the structured milestone maps to track quarterly sprints, team accountability, and target deadlines. By utilizing this standardized visual catalog, advisory partners and executive teams can eliminate manual design debt and focus on core strategic alignment, ensuring that their performance presentations project competence, administrative maturity, and corporate readiness across the entire enterprise.

3Key Use Cases: When to deploy the OKR Alignment Deck

The strategic relevance of the OKR Setting and Team Alignment framework is critical during several major corporate milestones and operational planning cycles. Key deployment scenarios include annual strategic planning retreats, quarterly business reviews (QBRs), post-merger integration (PMI) initiatives, and investor funding preparation. During annual planning sessions, the deck is utilized by executive teams to define and align the core company-wide objectives for the upcoming fiscal year. In quarterly reviews, the template acts as a high-fidelity dashboard to track progress, calibrate performance, and address lagging metrics before they affect year-end targets. During post-merger integrations, it provides a structured blueprint to align the newly combined workforce under unified performance standards. For start-up founders or VC teams preparing for Series A or Series B funding rounds, presenting a clear, cascading OKR roadmap demonstrates operational capability and strategic maturity, proving to investors that the organization has a rigorous execution engine capable of converting capital into scalable growth.

4Structural Outline: Recommended slide-by-slide OKR cascade

A complete, boardroom-ready OKR presentation must guide stakeholders through a logical narrative progression, cascading from high-level corporate vision to specific team initiatives. We recommend a 10-slide outline:

- Slide 1: Executive Title & Hook — Establishing the overarching vision and planning cycle.

- Slide 2: Corporate Mission & Strategic Context — Aligning the audience on the company's long-term direction.

- Slide 3: Annual Corporate Objectives — Highlighting the top 3-4 strategic goals for the fiscal year.

- Slide 4: The OKR Cascade Framework — Visualizing how company objectives link to divisional goals.

- Slide 5: Departmental OKR Breakdown — High-density dashboards outlining specific department metrics.

- Slide 6: Cross-Functional Alignment Matrix — Identifying dependencies, joint ownership, and resources.

- Slide 7: Phased Implementation Roadmap — A horizontal timeline mapping key milestones and check-ins.

- Slide 8: Key Result Dashboard & KPIs — Data-heavy tables showing targets, actuals, and ownership.

- Slide 9: Governance & Calibration Process — Detailing how progress is reviewed and targets updated.

- Slide 10: Next Steps & Immediate Initiatives — An active call-to-action outlining immediate next steps.

Following this comprehensive, ten-slide narrative progression ensures that your team understands not only their individual responsibilities but also how their daily efforts impact the broader corporate strategy.

5Design Rationale: McKinsey-Blue aesthetics for OKR clarity

Our OKR design system utilizes the 'mckinsey-blue' theme to replicate the visual authority and rigor of top-tier strategy consulting firms. The design prioritizes content legibility and logical structure above all else, ensuring that complex performance cascades remain clear. It relies on a high-contrast palette consisting of a 60% dominant background canvas, a 30% structured container grid, and a 10% vibrant light-blue accent color to highlight critical key results or targets. The layouts are locked to native 16:9 widescreen proportions to guarantee perfect rendering on boardroom projectors, high-definition desktop monitors, and mobile screens. Additionally, the template preserves at least 30% negative space on each slide, allowing high-density data tables and cascading timelines to breathe. This prevents visual clutter and reduces cognitive load, enabling executives to scan the slide and immediately identify progress status, metric trends, and strategic blockers, resulting in faster decision-making and better stakeholder alignment. Additionally, using Harvey Balls as qualitative indicators provides a quick visual summary of team confidence and key result completeness, which matches the standard reporting tools utilized by elite global consultancies. By carefully choosing contrast-rich typography and structured spacing, this system guarantees that your strategy meetings remain focused on operational output rather than design alignment.

6Integrating OKRs with Strategic Frameworks

To maximize the impact of your OKR presentation and build credibility with C-suite stakeholders, the objectives must be grounded in proven business frameworks. We recommend integrating:

* Balanced Scorecard (BSC): Map objectives across financial, customer, internal business process, and learning/growth perspectives.

* MECE (Mutually Exclusive, Collectively Exhaustive): Structure key results so they are mutually exclusive and collectively exhaustive, preventing overlap and ensuring completeness.

* Pyramid Principle: Organize your narrative so that supporting key results logically support the main objective.

* Porter's Five Forces: Define key results that address competitive rivalry, buyer bargaining power, and technological barriers.

* Growth Horizons: Align objectives with Horizon 1 (core business), Horizon 2 (emerging opportunities), and Horizon 3 (future options) plans.

Integrating these validated strategic frameworks demonstrates that your quarterly goals are not arbitrary numbers, but are linked to rigorous business logic, showcasing executive readiness and analytical thoroughness. For example, using the MECE framework guarantees that your team key results cover all necessary drivers of success without duplication, protecting the strategic focus from dilution. Grounding your slides in these corporate strategy methodologies ensures your presentation speaks the language of senior executives and corporate board members, establishing immediate authority and alignment.

7Storylining OKR Progress: Leading with Outcomes

Vidslides and executive reviews are most effective when they focus on outcomes rather than activities. To achieve this, apply Barbara Minto's Pyramid Principle to your OKR storylining. Every slide title must be written as an active, conclusion-focused headline instead of a passive label. For example, instead of naming a slide 'Sales Key Results,' write an active headline like 'Sales team achieved 35% ARR growth to validate enterprise market fit.' Under this main headline, every supporting key result, dashboard table, or metric chart must represent a MECE sub-argument that validates the slide's core claim. This narrative discipline ensures that busy board members and executive stakeholders can scan your deck in under two minutes and understand the entire operational status and strategic direction. It transforms your OKR review from a boring list of tasks into a strategic narrative that highlights achievement, addresses blockers, and drives immediate alignment on key priorities. When presenting to investment committees or corporate directors, this structured narrative flow is essential to maintain interest and build consensus. Leading with conclusions prevents the audience from getting lost in granular data, allowing you to highlight resource requests and strategic decisions with ultimate clarity and persuasiveness.

8Professional Formatting Guidelines for OKR Dashboards

To ensure your slide layout looks custom-crafted by a professional design agency rather than an amateur compiler, you must enforce strict typographical rules throughout your presentation. Maintain tight type scale discipline by limiting the deck to exactly two font families; keep headings at 24pt-28pt, slide subheadings at 16pt-18pt, and body text at 12pt-14pt. Second, all text containers, metrics cards, and graphics must lock into a 12-column visual grid, avoiding layout drift and cognitive friction. Third, contrast ratios must exceed 4.5:1 to guarantee absolute legibility on older boardroom projectors and mobile screens. Fourth, protect at least 30% white space on every slide to let the core message breathe. Respecting these typographical and alignment rules ensures that your business strategy presentation communicates visual authority, organizational discipline, and extreme attention to detail, passing rigorous board standards easily. It is also critical to align all quantitative metrics horizontally to ensure that comparison data is easy to scan. By locking margins and ensuring zero overlapping text boxes, the strategy deck maintains a high-density, professional appearance that meets the expectations of C-suite executives and strategy consultants, preventing embarrassing formatting errors during board reviews.

9Quantifying Performance: OKR Automation vs. Manual Alignment

Manually creating OKR alignment slides in PowerPoint is a slow, frustrating task that often consumes 8 to 12 hours of formatting, aligning, and updating tables. This administrative debt drains valuable cognitive energy that CSOs and strategy leads should instead spend aligning teams and optimizing execution. XLSlides AI automates this design process, allowing you to compile premium, boardroom-ready OKR decks in under 60 seconds. Below is a comparison of manual vs. automated creation:

ParameterManual OKR DraftingXLSlides AI Automation
Average Time Invested8 to 12 hours of alignmentUnder 60 seconds total
Grid Alignment PrecisionEyeballed (prone to errors)Automated 12-column pixel grid
Brand ConsistencyMargins and fonts drift easily100% locked to corporate guides
PowerPoint CompatibilityHard to format and exportNative 16:9 vector PPTX files
Academic FrameworksDrafted manually from scratchBuilt-in MECE & BSC structures
Average Design Cost~$250/hour designer feeIncluded in monthly Pro plans

Transitioning to automation represents a significant operational multiplier, ensuring professional excellence. It enables strategy leads to concentrate their efforts on alignment rather than alignment checks.

10Common OKR Presentation Mistakes to Avoid

To ensure your OKR presentation passes executive scrutiny and drives effective team alignment, you must avoid these five critical pitfalls:

- Defining Too Many Objectives: Keep it focused; aim for a maximum of 3-5 high-impact objectives per planning cycle.

- Setting Unmeasurable Key Results: Key results must be quantitative; if they cannot be measured with a metric, they are tasks, not key results.

- Cramming Slides with Text: Avoid long paragraphs; convert dense descriptions into clean, horizontal column cards or structured tables.

- Ignoring Cross-Functional Dependencies: Ensure joint ownership is clearly visualized; isolated silos lead to execution failure.

- Using Poor Contrast Layouts: Make sure all dashboard metrics and status indicators are readable on older boardroom projectors.

Avoiding these common presentation errors guarantees that your OKR deck retains executive attention, communicates operational excellence, and builds professional trust across all corporate environments. Additionally, failing to update progress updates in real time can make the data look stale, which damages credibility. Ensure that every status badge is accurate, and clearly document the owners of each key result to establish a culture of direct accountability and organizational discipline throughout the planning period.