Food Waste Reduction Strategy Presentation Template

Stop wasting hours on manual formatting. Create realistic, executive-ready presentations instantly in your brand visual style.

Waste source, spoilage driver, inventory, and process diagnostic slides
Cost savings, diversion, donation, shrink, and sustainability KPI dashboards
Operating model, partner network, risk, governance, and rollout roadmap visuals

1What a Food Waste Reduction Strategy Needs to Prove

A food waste reduction strategy should prove where waste is created, why it happens, what interventions will reduce it, and how the business will capture financial and sustainability benefits. Leaders need to see waste by source, product category, location, process step, spoilage driver, forecast error, inventory practice, operational behavior, and disposal route. The deck should connect waste reduction to cost savings, margin improvement, emissions reduction, donation impact, compliance, and customer trust. It should also distinguish avoidable waste from unavoidable byproducts or quality losses. This gives retail leaders, foodservice operators, manufacturers, distributors, sustainability teams, procurement leaders, finance stakeholders, donation partners, operations teams, PMOs, and consultants enough evidence to assess waste baseline, intervention priority, cost savings, diversion potential, operational feasibility, sustainability impact, and rollout sequencing. The narrative should also define category owners, process changes, partner dependencies, KPI gates, and adoption checkpoints for each rollout wave before scaled rollout approval decisions and monthly reporting review cycles.
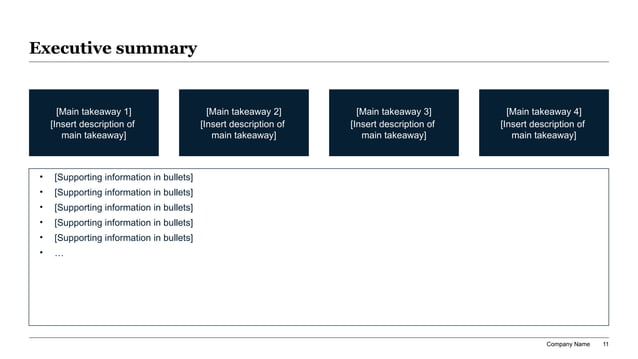
Food waste reduction strategy executive summary slide with four dark blue takeaway cards and supporting bullets for shrink and diversion planning.
Template Design LayoutFood Waste Reduction Strategy Presentation Template

2Who This Template Is Built For

This template is built for teams that need to present food waste reduction as an operating and financial improvement program. Typical users include grocery retailers, restaurants, hotels, foodservice providers, food manufacturers, distributors, cold-chain logistics teams, sustainability leaders, procurement teams, finance leaders, merchandising teams, compliance teams, donation coordinators, and consultants. It is useful when stakeholders must approve a waste reduction initiative, justify investment in forecasting or inventory tools, build a donation program, improve shrink performance, or report progress against sustainability targets. The audience usually needs a practical plan that links waste sources to operational action. This gives retail leaders, foodservice operators, manufacturers, distributors, sustainability teams, procurement leaders, finance stakeholders, donation partners, operations teams, PMOs, and consultants enough evidence to assess waste baseline, intervention priority, cost savings, diversion potential, operational feasibility, sustainability impact, and rollout sequencing. The narrative should also define category owners, process changes, partner dependencies, KPI gates, and adoption checkpoints for each rollout wave.

3Waste Source Mapping and Baseline

The baseline section should quantify food waste before proposing solutions. It should cover waste by site, department, product category, supplier, process step, date code, storage condition, preparation area, serving line, returns, and disposal route. The deck should separate shrink, spoilage, overproduction, trimming loss, damaged goods, customer plate waste, expired stock, and byproducts. A useful baseline combines financial value, volume, emissions impact, and preventability so priorities are not based on tonnage alone. It should also show data gaps, because many organizations track waste inconsistently across sites. This gives retail leaders, foodservice operators, manufacturers, distributors, sustainability teams, procurement leaders, finance stakeholders, donation partners, operations teams, PMOs, and consultants enough evidence to assess waste baseline, intervention priority, cost savings, diversion potential, operational feasibility, sustainability impact, and rollout sequencing. The narrative should also define category owners, process changes, partner dependencies, KPI gates, and adoption checkpoints for each rollout wave before scaled rollout approval decisions and monthly reporting review cycles.

4Forecasting, Inventory, and Demand Planning Levers

Many food waste issues begin with demand uncertainty, so the deck should show forecasting and inventory levers clearly. It should cover order accuracy, replenishment frequency, safety stock, promotional planning, production scheduling, shelf-life management, markdown timing, batch sizing, menu planning, and substitution rules. The presentation should identify where better demand signals or decision rules can reduce excess inventory without hurting availability. It should also show how weather, events, seasonality, local preferences, delivery windows, and supplier reliability affect waste. Strong pages connect forecasting changes to both waste reduction and service-level protection. This gives retail leaders, foodservice operators, manufacturers, distributors, sustainability teams, procurement leaders, finance stakeholders, donation partners, operations teams, PMOs, and consultants enough evidence to assess waste baseline, intervention priority, cost savings, diversion potential, operational feasibility, sustainability impact, and rollout sequencing. The narrative should also define category owners, process changes, partner dependencies, KPI gates, and adoption checkpoints for each rollout wave before scaled rollout approval decisions and monthly reporting review cycles.

5Store, Kitchen, and Manufacturing Operations

Operational waste reduction depends on daily behavior, not only analytics. The deck should cover receiving checks, cold-chain discipline, storage rotation, prep standards, batch production, portion control, quality grading, display rules, recipe management, staff training, and end-of-day routines. It should identify which procedures vary by site and which should be standardized. For manufacturers, the section can address line changeovers, yield loss, rework, trimming, quality rejects, and packaging defects. For foodservice, it may focus on menu engineering, buffet management, and plate waste. This gives retail leaders, foodservice operators, manufacturers, distributors, sustainability teams, procurement leaders, finance stakeholders, donation partners, operations teams, PMOs, and consultants enough evidence to assess waste baseline, intervention priority, cost savings, diversion potential, operational feasibility, sustainability impact, and rollout sequencing. The narrative should also define category owners, process changes, partner dependencies, KPI gates, and adoption checkpoints for each rollout wave before scaled rollout approval decisions and monthly reporting review cycles.

6Donation, Redistribution, and Upcycling Options

Diversion pages should show how surplus food can be redirected safely and economically. The deck may cover donation partners, food rescue logistics, eligibility rules, cold-chain requirements, liability protections, traceability, staff procedures, packaging, pickup cadence, and community impact. It should also evaluate upcycling, secondary markets, animal feed, composting, anaerobic digestion, and waste-to-energy options for food that cannot be sold or donated. The goal is to prioritize prevention first, then create responsible pathways for remaining surplus. A good diversion plan is grounded in operational feasibility and food safety, not only goodwill. This gives retail leaders, foodservice operators, manufacturers, distributors, sustainability teams, procurement leaders, finance stakeholders, donation partners, operations teams, PMOs, and consultants enough evidence to assess waste baseline, intervention priority, cost savings, diversion potential, operational feasibility, sustainability impact, and rollout sequencing. The narrative should also define category owners, process changes, partner dependencies, KPI gates, and adoption checkpoints for each rollout wave before scaled rollout approval decisions and monthly reporting review cycles.

7Cost Savings, P&L Impact, and Business Case

The business case should translate waste reduction into P&L value. Useful measures include shrink cost, food cost percentage, disposal cost, labor impact, markdown recovery, donation tax treatment where applicable, avoided purchasing, margin improvement, and revenue protection from better availability. The deck should separate one-time implementation costs from recurring savings and identify investments in systems, training, equipment, partner fees, or process redesign. Finance teams will want to see baseline assumptions, savings by intervention, payback period, and risk of double counting. A strong business case makes sustainability financially actionable. This gives retail leaders, foodservice operators, manufacturers, distributors, sustainability teams, procurement leaders, finance stakeholders, donation partners, operations teams, PMOs, and consultants enough evidence to assess waste baseline, intervention priority, cost savings, diversion potential, operational feasibility, sustainability impact, and rollout sequencing. The narrative should also define category owners, process changes, partner dependencies, KPI gates, and adoption checkpoints for each rollout wave before scaled rollout approval decisions and monthly reporting review cycles.

8Sustainability Reporting and Compliance

Sustainability sections should show how food waste reduction supports broader reporting and compliance goals. The deck can cover landfill diversion, methane avoidance, Scope 3 emissions, donation meals, circular economy metrics, packaging interaction, local regulations, customer commitments, and voluntary reporting frameworks. It should explain how waste data will be measured, verified, and reported across sites. If regulatory requirements or corporate targets are material, the presentation should define evidence owners and reporting cadence. The strongest sustainability pages connect waste reduction to both environmental impact and operating discipline, rather than treating it as a separate communications story. This gives retail leaders, foodservice operators, manufacturers, distributors, sustainability teams, procurement leaders, finance stakeholders, donation partners, operations teams, PMOs, and consultants enough evidence to assess waste baseline, intervention priority, cost savings, diversion potential, operational feasibility, sustainability impact, and rollout sequencing. The narrative should also define category owners, process changes, partner dependencies, KPI gates, and adoption checkpoints for each rollout wave.

9KPI Dashboard and Governance Model

The KPI section should define how progress will be managed. Useful metrics include waste volume, waste value, shrink rate, diversion rate, donation volume, markdown recovery, forecast accuracy, sell-through, disposal cost, food cost percentage, emissions avoided, site compliance, training completion, and intervention adoption. The dashboard should show baseline, target, owner, cadence, and decision trigger for each measure. Governance pages should define category owners, site leaders, finance support, sustainability reporting, donation partner management, and escalation rules. Without governance, waste reduction often stays as a pilot rather than becoming an operating rhythm. This gives retail leaders, foodservice operators, manufacturers, distributors, sustainability teams, procurement leaders, finance stakeholders, donation partners, operations teams, PMOs, and consultants enough evidence to assess waste baseline, intervention priority, cost savings, diversion potential, operational feasibility, sustainability impact, and rollout sequencing. The narrative should also define category owners, process changes, partner dependencies, KPI gates, and adoption checkpoints for each rollout wave before scaled rollout approval decisions and monthly reporting review cycles.

10Rollout Roadmap and XLSlides Workflow

The rollout roadmap should sequence food waste reduction through baseline measurement, site segmentation, intervention design, pilot launch, partner setup, staff training, KPI review, operating model refinement, scale-up, reporting integration, and continuous improvement. Early waves should focus on categories or locations where waste value is high and operational changes are feasible. Later waves can add forecasting tools, supplier collaboration, donation expansion, and deeper sustainability reporting. XLSlides helps teams convert waste audits, shrink data, forecasting assumptions, partner plans, cost savings, sustainability metrics, and rollout milestones into a structured strategy deck. The generated output gives teams a strong working draft that can be refined with actual site data, finance signoff, partner input, and named owners. This gives retail leaders, foodservice operators, manufacturers, distributors, sustainability teams, procurement leaders, finance stakeholders, donation partners, operations teams, PMOs, and consultants enough evidence to assess waste baseline, intervention priority, cost savings, diversion potential, operational feasibility, sustainability impact, and rollout sequencing. The narrative should also define category owners, process changes, partner dependencies, KPI gates, and adoption checkpoints for each rollout wave.