Customer Lifetime Value (CLV) Modeling Presentation Templates

Stop wasting hours on manual formatting. Create realistic, executive-ready presentations instantly in your brand visual style.

Cohort analysis visualizations
Retention impact models
High-value segment targeting

1The Strategic Imperative of Customer Lifetime Value (CLV) in Corporate Strategy

In the modern corporate ecosystem, maximizing shareholder value requires a relentless focus on customer unit economics. Customer Lifetime Value (CLV) is not merely a marketing metric; it serves as a foundational strategic pillar that guides capital allocation, product development, and corporate strategy. For management consultants, strategy partners, and finance directors, modeling CLV provides a quantitative basis for assessing the long-term viability of a business model and the efficiency of its customer acquisition engine. Incremental changes in retention rates or average order value compile over time, significantly impacting corporate valuation. By presenting CLV trends using structured, boardroom-ready widescreen slides, leadership teams can align steering committees and secure investment approval for growth initiatives. This template is designed to translate complex cohort dynamics into clear, high-contrast visual models. By mapping customer lifetime value against acquisition costs, organizations can transition from raw volume-based metrics to value-based strategic decisions, ensuring sustained competitive advantage and capital efficiency.
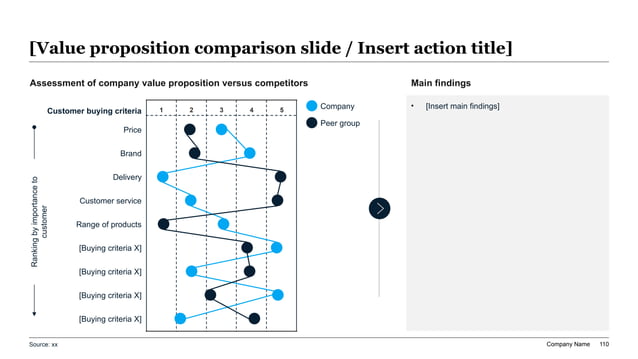
Widescreen split-layout slide featuring a dual-curve value proposition profile comparison chart on the left and a key findings card panel on the right with custom icons.
Template Design LayoutCustomer Lifetime Value (CLV) Modeling Presentation Templates

2Applying Barbara Minto's Pyramid Principle to CLV Presentations

When presenting complex customer lifetime value metrics to C-suite executives and private equity sponsors, strategy teams must avoid drowning the audience in analytical noise. High-stakes communication requires structuring the narrative using Barbara Minto's Pyramid Principle. This methodology mandates leading with the primary conclusion first, where every slide headline delivers an active, strategic recommendation rather than a passive label. For example, instead of titling a slide 'Cohort Analysis,' a strategy partner should write: 'Cohort Analysis Reveals Q3 Retargeting Campaign Lifted High-Value Segment Retention by 14%.' Under this primary claim, you group your supporting evidence into mutually exclusive and collectively exhaustive (MECE) sub-arguments. This ensures that the board can digest the strategic significance of each cohort's performance in under ten seconds. By storylining your CLV presentation decks around active executive decisions and clear operational thresholds, you shift the boardroom conversation from debating background metrics to aligning on capital deployment and marketing efficiency strategies.

3Structuring a MECE Cohort Analysis Framework for Boardroom Reviews

A granular understanding of customer lifetime value requires segmenting the customer base into distinct, non-overlapping cohorts. Applying the MECE (Mutually Exclusive, Collectively Exhaustive) framework ensures that every customer is assigned to a single cohort with zero overlap and no customer is left unaccounted for. This structural discipline is critical for preventing double-counting or data leakage, which can distort the integrity of your financial projections. Cohort analysis allows strategy teams to track behavioral changes over time, isolating the impact of product releases, pricing changes, or marketing campaigns. Presenting these cohorts in a structured matrix slide helps board members visualize the lifecycle of different customer segments. Instead of displaying a single, aggregated average, which often masks underlying churn issues, a MECE cohort matrix reveals exactly where and when customer value decays. This level of rigor projects administrative authority and provides a solid, data-driven foundation for selecting customer retention priorities and allocating corporate resources.

4Quantitative Modeling of LTV-to-CAC Ratios for Investment Committees

To justify marketing budgets and customer acquisition investments to investment committees, finance executives must present a clear, quantitative LTV-to-CAC model. An optimized LTV:CAC ratio projects marketing efficiency and customer profitability, proving that the organization can scale its customer base sustainably. A ratio of 3:1 is generally considered the industry standard for healthy growth, while ratios below 2:1 signal customer acquisition inefficiencies, and ratios above 5:1 suggest underinvestment in market expansion. The table below outlines a standard enterprise LTV-to-CAC optimization model designed for strategy partners and finance leads:

Customer SegmentCustomer Acquisition Cost (CAC)Customer Lifetime Value (LTV)LTV to CAC RatioStrategic Action Plan
Enterprise Accounts$15,000$75,0005.0 : 1Increase account management coverage
Mid-Market Clients$4,500$14,4003.2 : 1Optimize onboarding via automated toolkits
SMB & Professional Users$750$1,5002.0 : 1Deploy self-service digital support models

Presenting these metrics in a clean, visual grid demonstrates deep financial control and gives board members confidence that capital is allocated efficiently.

5The McKinsey-Blue Design System for High-Stakes Strategy Decks

High-stakes strategy presentations demand a visual language that projects gravity, precision, and executive authority. This template is designed around our premium 'mckinsey-blue' design theme, specifically tailormade for investment committee meetings, competitive reviews, and boardroom briefings. The palette uses a clean, light-grey background canvas to project professionalism and modern design principles. The design enforces a strict 60-30-10 color distribution: a 60% dominant background canvas prevents visual clutter, a 30% structured layout grid (using slate-blue card containers) organizes data tables and cohort metrics, and a 10% high-contrast accent key (such as deep royal blue) highlights key LTV figures and timeline milestones. All text containers, metrics cards, and graphics must align perfectly to a 12-column visual grid, avoiding layout drift. Furthermore, we enforce at least 30% negative space on every slide to let the design breathe and prevent cognitive fatigue, ensuring board members can focus entirely on strategic decisions rather than formatting errors.

6Visualizing CLV Retention Curves and Segment Value Profiles

To visualize the distribution of customer lifetime value across different segments, this template utilizes a specialized split-layout slide configuration. This layout displays two distinct panels: a dual-curve comparison chart on the left, and a key findings card panel on the right. The dual-curve chart compares the value proposition profile of your high-value cohorts against a peer group or baseline average, illustrating how retention rates decay over time. For strategy consulting partners, this visual structure is essential for presenting complex retention models. Instead of displaying multiple slides, which dilutes the comparative context, the split layout allows board members to contrast performance side-by-side. The clear visual curves help contrast customer half-life, payback periods, and churn thresholds, providing a solid foundation for customer success decisions and ensuring the organization's capital is deployed to the most resilient customer segments, protecting long-term enterprise value, enhancing customer loyalty strategies, and minimizing marketing investment vulnerabilities across the entire portfolio. Additionally, strategy partners can use this visualization to demonstrate to private equity investors that their customer cohort value is increasing over time, justifying higher acquisition multiples. By clearly presenting these trends, management can protect their strategic initiatives from short-sighted budget cuts and focus resources on compounding customer relationships.

7Formulating Growth and Expansion Strategy Playbooks for High-Value Segments

Once high-value customer cohorts have been identified, the organization must deploy targeted expansion strategies to maximize their lifetime value. Rather than applying a uniform marketing strategy, growth strategy leads should formulate tailored playbooks focused on upselling, cross-selling, and contract expansions. The list below highlights the core strategic pillars required to construct an effective customer lifetime value expansion playbook:

  • Value-Based Tier Structuring**: Aligning product features and service-level agreements (SLAs) to specific segment willingness-to-pay.
  • Proactive Account Health Monitoring**: Utilizing automated health scores to detect early signs of account churn or stagnation.
  • Contract Expansion Incentivization**: Offering multi-year contract discounts to lock in long-term recurring revenue streams.
  • Customer Success Enablement**: Equipping account managers with custom ROI calculators to demonstrate software value during reviews.

Documenting these expansion initiatives prepares your team to execute targeted growth strategies without operational delay, driving higher retention and net revenue expansion. Furthermore, these playbooks establish a repeatable framework for client onboarding and account management, ensuring that all divisions deliver a consistent, high-value client experience that reinforces brand loyalty and maximizes customer lifetime value.

8Setting Up Operational KPI Dashboards and Performance Metrics

To prove the effectiveness of your customer lifetime value optimization strategy to corporate controllers and institutional investors, you must track and report quantitative performance metrics. Qualitative claims like 'customer relationships are improving' will not satisfy rigorous board reviews. You must measure the reach, engagement, and financial impact of your initiatives using objective Key Performance Indicators (KPIs). These metrics should be tracked weekly and compiled into an operational dashboard slide. For instance, monitoring cohort retention rates, customer acquisition costs, average contract value, and payback periods provides a clear picture of marketing efficiency. Additionally, regular net promoter score (NPS) surveys can track customer satisfaction and sentiment trends. The following list highlights the core KPIs that strategy teams should track to measure CLV success:

  • Net Revenue Retention (NRR)** - Measures the growth of recurring revenue from existing customers.
  • Customer Payback Period** - Tracks the number of months required to recover acquisition costs.
  • High-Value Segment Churn** - Monitors the loss rate of your top-tier customer cohorts.
  • Average Revenue Per Account (ARPU)** - Tracks expansion and pricing optimization success.

9How to Generate Professional CLV Strategy Presentations with XLSlides AI

Designing corporate presentations manually in PowerPoint is a notoriously slow, tedious process that often costs strategy teams and finance analysts 12 to 16 hours of formatting work. Adjusting text box margins, aligning cohort tables, and styling comparison charts manually is an inefficient use of valuable resources. XLSlides AI automates this layout design process, allowing strategy partners to generate premium, boardroom-ready customer lifetime value presentations in under 60 seconds. The AI engine performs intelligent, context-aware layout mapping, translating your CLV narrative and acquisition tables into structured column cards, comparison curves, and timeline matrices. Design parameters are automatically locked to your chosen style preset, preventing font or margin drift. The completed presentation exports as fully editable PowerPoint vector shapes, allowing you to easily adjust schedules, customize copy, or import company-specific branding, ensuring professional excellence at the click of a button. By transforming the presentation workflow, teams can allocate their analytical energy to interpreting cohort data and executing growth initiatives rather than fighting slide margins.

10Copy-Pasteable Prompt Engineering Recipe for Advanced CLV Slides

To help corporate advisors, management consultants, and growth strategy leads generate high-impact customer lifetime value decks instantly, our models support optimized prompt recipes. Providing a detailed, context-rich instruction set to the AI presentation builder eliminates hours of tedious manual formatting. Our AI understands structured strategic syntax and automatically converts raw text instructions into clean visual components, such as cohort matrices and LTV:CAC comparison tables. Below is a highly optimized, copy-pasteable prompt engineering recipe tailored for this strategy template:

```text

Generate a professional Customer Lifetime Value (CLV) presentation using the McKinsey-Blue design preset. The deck must include a split 16:9 template with a dual-curve value proposition profile comparison chart on the left, a 3-column cohort analysis grid, an LTV to CAC optimization table comparing Enterprise, Mid-Market, and SMB, and a 4-step retention strategy timeline. Keep margins aligned to a 12-column grid.

```

Using this recipe ensures the AI applies correct grid alignments, mapping your customer metrics to appropriate visual layouts in under 60 seconds.