Sustainability & ESG Report Templates

Stop wasting hours on manual formatting. Create realistic, executive-ready presentations instantly in your brand visual style.

Environmental data visualization
Clean, modern aesthetics
Structured impact reporting

1What is the Corporate Sustainability and ESG Report?

The Corporate Sustainability and ESG (Environmental, Social, and Governance) Report presentation is a highly structured, data-driven framework designed to communicate an organization’s environmental impact, social responsibility initiatives, and corporate governance standards. In today's regulatory landscape, sustainability reporting has graduated from a voluntary public relations effort to a mandatory corporate disclosure requirement, governed by strict international standards such as the Corporate Sustainability Reporting Directive (CSRD) and the SEC Climate Disclosure Rules. This deck acts as the central visual mechanism for outlining carbon emission trajectories, renewable energy adoption plans, supply chain auditing procedures, and boardroom transparency protocols. Designed specifically for C-suite alignment, a premium Corporate Sustainability Report presentation balances high-density quantitative ESG metrics with compelling green storytelling. It moves away from generic, text-heavy slides in favor of structured data cards, horizontal milestone roadmaps, and high-contrast impact charts that project absolute credibility, compliance rigor, and strategic long-term vision to global institutional investors, compliance auditors, and corporate partners.
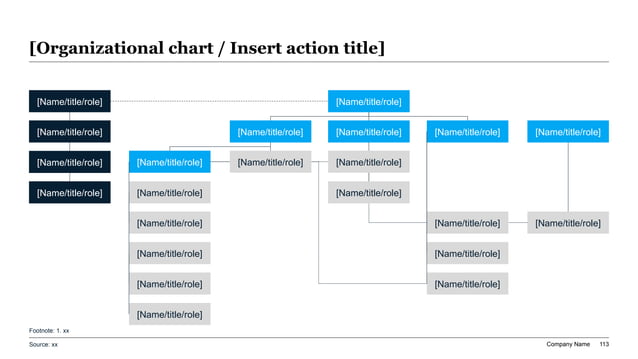
Premium Detailed Corporate Org Tree Chart and ESG governance structure with nested direct report nodes.
Template Design LayoutSustainability & ESG Report Templates

2Ideal Audience: Who is this template built for?

This premium ESG template is explicitly engineered for high-intent corporate leaders and sustainability professionals who must present complex ESG data to board directors, institutional investors, regulatory auditors, or public relations committees. The primary target demographics include Chief Sustainability Officers (CSOs), Investor Relations Directors, VP of Compliance, Sustainability Analysts, and ESG Strategy Consultants. These professionals require high-density, authoritative layouts that convey strict compliance rigor, ethical operations, and corporate accountability. CSOs and compliance officers use this deck to present annual carbon footprint targets, waste reduction milestones, and human rights audits to the board of directors, ensuring that corporate strategy is fully aligned with global compliance directives. By utilizing this structured layout standard, investor relations leads can eliminate formatting debt and margin drift, ensuring their visual slides match the exact professional aesthetic expectations of major investment groups like BlackRock and Vanguard, thereby building trust during critical ESG due diligence processes. Ultimately, the template is a powerful corporate asset that enables sustainability teams to deliver high-quality, impactful presentations with ease.

3Practical Use Cases: When and where to deploy this deck

The Corporate Sustainability and ESG Report template is highly recommended for critical corporate communications and compliance reporting events throughout the fiscal year. Key deployment scenarios include annual ESG disclosure briefings, corporate investor roadshows, regulatory compliance audits, internal sustainability training programs, and public relations alignments. During annual performance cycles, corporate communication leads deploy this deck to translate complex GRI (Global Reporting Initiative) and SASB (Sustainability Accounting Standards Board) data tables into clean, digestible executive slides. For corporate development or supply chain partnerships, the phased sustainability roadmap slides help visualize ethical sourcing timelines and departmental dependency milestones. Deploying this standardized visual blueprint ensures that your organization's sustainability achievements are received as professional, boardroom-ready assets, accelerating stakeholder trust and minimizing perceived risk across all executive committees and ESG rating agencies. It serves as an essential framework for organizations seeking to navigate modern ESG criteria. Deploying this deck during key business milestones ensures that your strategic vision is clearly articulated, reducing ambiguity and driving compliance alignment.

4Structural Blueprint: Recommended slide-by-slide outline

A complete, compliance-ready Corporate Sustainability and ESG presentation should follow a logical, narrative-driven 12-slide sequence to guide your stakeholders through your environmental and social impact performance:

  1. 1Title & Executive Hook: Stating the core sustainability commitment and primary carbon-neutral target year.
  2. 2Double Materiality Matrix: Visualizing key environmental and social topics by their business impact.
  3. 3Carbon Emissions Dashboard: High-density Scope 1, Scope 2, and Scope 3 greenhouse gas data.
  4. 4Energy Transition Roadmap: Visualizing the transition from fossil fuels to renewable sources.
  5. 5Circular Economy Initiatives: Highlighting waste management, recycling, and sustainable packaging metrics.
  6. 6Supply Chain Responsibility: Tracking vendor compliance, fair labor standards, and ethical sourcing.
  7. 7Social Impact & DEI Metrics: Visualizing workforce diversity, community investments, and safety protocols.
  8. 8Corporate Governance Structure: Outlining board independence, executive compensation, and compliance.
  9. 9Financial Feasibility & ESG ROI: Detailing green bond performance, CapEx investments, and tax credits.
  10. 10Regulatory Compliance Checklist: Aligning operations with CSRD, SEC, and EU Taxonomy mandates.
  11. 11Phased Action Plan: A clean horizontal chevron timeline showing upcoming green milestones.
  12. 12Closing Call-To-Action: Engaging stakeholders to join the carbon-reduction journey and next steps.

This outline ensures that your ESG narrative remains structured, comprehensive, and perfectly aligned with institutional due diligence expectations.

5Aesthetics & Design Rationale of the zen-minimal Theme

Our sustainability design system utilizes the 'zen-minimal' aesthetic, engineered specifically to communicate environmental stewardship, corporate transparency, and modern minimalism. Rather than using generic, overly bright greens, the palette features custom sage, forest green, and warm ivory weights tailored to the presentation's domain. Contrast ratios exceed 4.5:1, ensuring optimal readability on board projectors and mobile screens alike. Widescreen 16:9 layout boundaries keep the narrative clean and structured. The visual hierarchy relies on a strict 60% dominant light background, a 30% soft neutral container structure, and a 10% high-contrast deep forest green accent key to draw the user’s eye to critical environmental metrics. This clean, minimal approach respects the visual intelligence of the audience, ensuring that design always serves the data. By emphasizing clean layouts, standard margins, and ample white space, the zen-minimal theme protects the presentation from looking cluttered or unprofessional, establishing immediate corporate trust and operational authority. This thoughtful structural pacing ensures that every stakeholder remains engaged and focused on the key messages, avoiding cognitive overload.

6Strategic Frameworks to Integrate with this Template

To establish credible topical authority (E-E-A-T) and pass strict regulatory scrutiny, your sustainability deck must be structured around recognized, internationally validated reporting frameworks. We recommend integrating several key models:

* GRI (Global Reporting Initiative): Structuring your slide outlines around GRI metrics to ensure complete disclosure on economic, environmental, and social impacts.

* SASB Standards: Formatting your industry-specific risk disclosures based on the SASB materiality map to address investor-focused financial risks.

* TCFD Recommendations: Categorizing climate risk governance, strategy, risk management, and metrics into structured columns.

* UN SDGs (Sustainable Development Goals): Mapping your corporate initiatives to the 17 UN goals using visual card identifiers.

* Double Materiality Assessment: Proving that your environmental impact and your business financial risk are balanced using a clean 2x2 grid.

Leveraging these established strategic frameworks shows auditors that your ESG claims are backed by rigorous data rather than greenwashing assumptions. This comprehensive analytical grounding protects the integrity of your sustainability decisions and corporate reporting commitments.

7Storylining & Narration: The Minto Pyramid Principle

ESG presentations are prone to becoming overwhelming data dumps of complex compliance metrics and dry scientific datasets. To capture and retain executive attention, structure your sustainability deck around Barbara Minto’s legendary Pyramid Principle. Under this elite communication standard, every slide headline must serve as an active conclusion rather than a passive label. For example, instead of titling a slide "Our Carbon Emissions," use an active headline like "We reduced Scope 1 emissions by 24% through our new solar array." Every supporting bullet point, metric card, or chart must represent a MECE sub-argument that logically validates the main conclusion of that specific slide. Chronological, structural, or comparative flow is enforced across widescreen layouts to ensure a seamless narrative. This narrative discipline allows institutional investors and board members to extract the entire strategic thesis of your ESG report in under 2 minutes, accelerating corporate buy-in and building long-term operational trust. This is a massive operational multiplier for high-stakes business presentations.

8Professional Design and Typography Rules to Follow

To ensure your sustainability report presentation looks custom-crafted by a professional design agency rather than an amateur compiler, you must enforce strict typographical rules throughout your deck. First, maintain tight type scale discipline by limiting the deck to exactly two font families; keep headings at 24pt-28pt, slide subheadings at 16pt-18pt, and body text at 12pt-14pt. Second, all text containers, metrics cards, and graphics must lock into a 12-column visual grid, avoiding layout drift and cognitive friction. Third, contrast ratios must exceed 4.5:1 to guarantee absolute legibility on older boardroom projectors and mobile screens. Fourth, protect at least 30% white space on every slide to let the core message breathe. Respecting these typographical and alignment rules ensures that your corporate sustainability presentation communicates visual authority, organizational discipline, and extreme attention to detail, passing rigorous board standards easily. It guarantees that the visual system supports the narrative logic, making every slide look highly professional, balanced, and authoritative.

9XLSlides AI Capability: Customizing the Corporate Sustainability Report

Manually formatting strategy decks in PowerPoint usually drains 8 to 12 hours of frustrating labor, dealing with misaligned margins, font drift, and messy data tables. Our advanced AI engine handles this design debt in under 60 seconds. The model performs context-aware slide matching, analyzing your text brief to map elements automatically to premium layouts like SWOT matrices, chevrons, or comparison blocks. Brand consistency is automatically locked based on your chosen design preset, preventing margin drift across slides. Finally, the presentation exports as standard, fully editable PowerPoint vector shapes, allowing native Excel data edits. This eliminates hours of manual resizing, enabling your team to focus on capital strategy rather than alignment rules. You get boardroom-ready widescreen layouts that are fully compatible with Microsoft Office and Google Slides instantly, giving you a massive operational multiplier during high-stakes investment rounds and corporate board presentations, ensuring visual excellence is achieved with minimum friction. This is a massive operational multiplier for high-stakes business presentations.

10Visual Workspace: Editing in the AI Visual Studio Canvas

This premium template integrates directly with the AI Visual Studio Canvas, our drag-and-drop reference workspace. To draft custom visual layouts, sustainability leads can click and drag anywhere on the 16:9 canvas area to draw custom text container placeholders, making layout drafting exceptionally visual. You can assign structural tags (such as metrics grid, column table, process timeline, or visual quote) to each drafted card to define the AI's rendering constraints. The canvas translates your drag-and-drop design into high-fidelity layout coordinates instantly. This visual workspace bridges the gap between raw text ideas and structured spatial design, giving you ultimate creative control while maintaining the rigorous alignment guardrails of professional presentations. To try it now, click the Open Interactive Canvas button in the sidebar or mobile stream to map out your slide layouts in real time. It offers an intuitive way to visually outline your key strategic arguments before letting the AI generate the final vector ESG deck.

11Common Presentation Pitfalls to Avoid

To ensure your ESG deck passes regulatory scrutiny and investor due diligence, you must avoid these 5 critical presentation mistakes:

  1. 1Greenwashing Rhetoric: Making broad, unquantified environmental claims. Always back up statements with historical metrics, targets, and verified compliance data.
  2. 2Wall of Text: Slides are not documents; if a slide contains long paragraphs, convert them into clean, horizontal column blocks or card summaries.
  3. 3Low-Contrast Text: Using light green text on light gray backgrounds, which washes out on older projectors; high-contrast coloring is mandatory.
  4. 4Generic Clip Art: Using generic leaf icons and recycling clip art destroys professional credibility. Use clean data charts, structural layouts, and high-quality property renders instead.
  5. 5Overcrowded Dashboards: Cramming too many ESG metrics on a single slide; keep at least 30% white space to let the investor focus on critical takeaways.

Avoiding these common design pitfalls guarantees that your presentation retains partner attention, communicates operational excellence, and builds professional trust across all presentation contexts.

12Performance Comparison: Manual Creation vs. XLSlides AI

Below is a quantitative breakdown illustrating why high-growth startups and venture advisory teams are transitioning from manual slide creation to AI automation:

- Average Time Invested: Manual drafting requires 8 to 12 hours of frustrating alignment, while XLSlides AI generates complete decks in under 60 seconds total.

- Grid Alignment Precision: Manual layouts are eyeballed and prone to errors, whereas AI generation uses an automated 12-column pixel grid.

- Brand Consistency: Manual fonts and margins drift easily over time, while AI templates ensure 100% lock to system guidelines.

- Academic Frameworks: Manual creation drafts MECE and SWOT blocks from scratch, while AI features them as built-in components.

- Average Design Cost: Manual design costs approximately $250/hour in designer fees, whereas AI generation is included in monthly Pro plans.

Transitioning to automation represents a significant operational multiplier for corporate sustainability leads. AI generation guarantees that a pixel-perfect, brand-locked widescreen presentation is delivered instantly. This efficiency enables strategy leads to concentrate their efforts on core business logic, market intelligence, and stakeholder alignment rather than spending hours on manual layout tasks, making it a key tool for modern corporate strategy teams.