Fast Answer: What A Pricing Strategy Presentation Must Prove
A pricing strategy presentation should prove four things quickly. First, the pricing problem is real enough to matter now, whether the trigger is margin pressure, discount leakage, an upcoming launch, a segment shift, or a board request for profit improvement. Second, the economics are supportable. Executives need to see how price, volume, mix, discounts, churn, implementation cost, and timing connect. Third, the move is operationally executable. A pricing recommendation without a sales, finance, systems, and customer-communication plan is still a thought experiment. Fourth, the deck has to show the decision ask clearly, because pricing work usually fails when the audience leaves unsure what exactly they are approving.
That is why a serious pricing deck is not just a set of price points or a prettier version of a spreadsheet. It is an executive document that translates messy data into a recommendation: which segments to reprice, which packages to simplify, which exceptions to tighten, which risks to monitor, and which teams must own the rollout. Generic AI slides often miss this because they summarize the topic instead of carrying the judgment.
The most useful pricing presentations therefore behave like approval decks. They open with the answer, show the value logic behind the answer, pressure-test downside scenarios, and make implementation tradeoffs visible. If the audience can read only the summary, the economics page, the risk page, and the rollout page and still explain the move, the deck is doing its job.
Pricing Deck Essentials
- A strong pricing strategy presentation links the price move to segment economics, not to a generic margin target.
- Executives need explicit treatment of volume risk, discount behavior, packaging changes, and rollout ownership before they approve a pricing change.
- The best deck sequence is answer first, economics second, execution third, instead of burying the recommendation after research slides.
- AI is useful for assembling the first pricing deck draft, but humans still need to own the tradeoffs, assumptions, and customer-facing implications.
Which Pricing Decision The Deck Is Actually Supporting
Pricing decks look different depending on whether the team is repricing, redesigning packages, or defending margin in an executive review.
| Decision Type | What The Deck Must Show | Typical Audience |
|---|---|---|
| Broad price increase | Why the increase is needed now, how much room exists by segment, and what downside volume case still preserves value | CEO, CFO, CRO, business unit leader |
| Packaging or tier redesign | How the new value metric changes upsell, discounting, and customer comprehension relative to the current offer | Product, pricing, sales, finance |
| Discount discipline reset | Where margin is leaking, which exception behaviors are causing it, and what governance or guardrails should change | CRO, RevOps, finance, regional leaders |
| New product or segment pricing | What willingness-to-pay logic, competitor context, and adoption assumptions support the first price architecture | GM, product marketing, strategy, finance |
| Board or investor margin review | How pricing fits inside the broader profit-improvement plan, what risks remain, and what approval is required | Board, investors, CFO, CEO |
| Turnaround or underperformance review | Whether the problem is truly price, or whether mix, sales execution, service cost, or product complexity is the bigger driver | Transformation office, consultants, operating leadership |
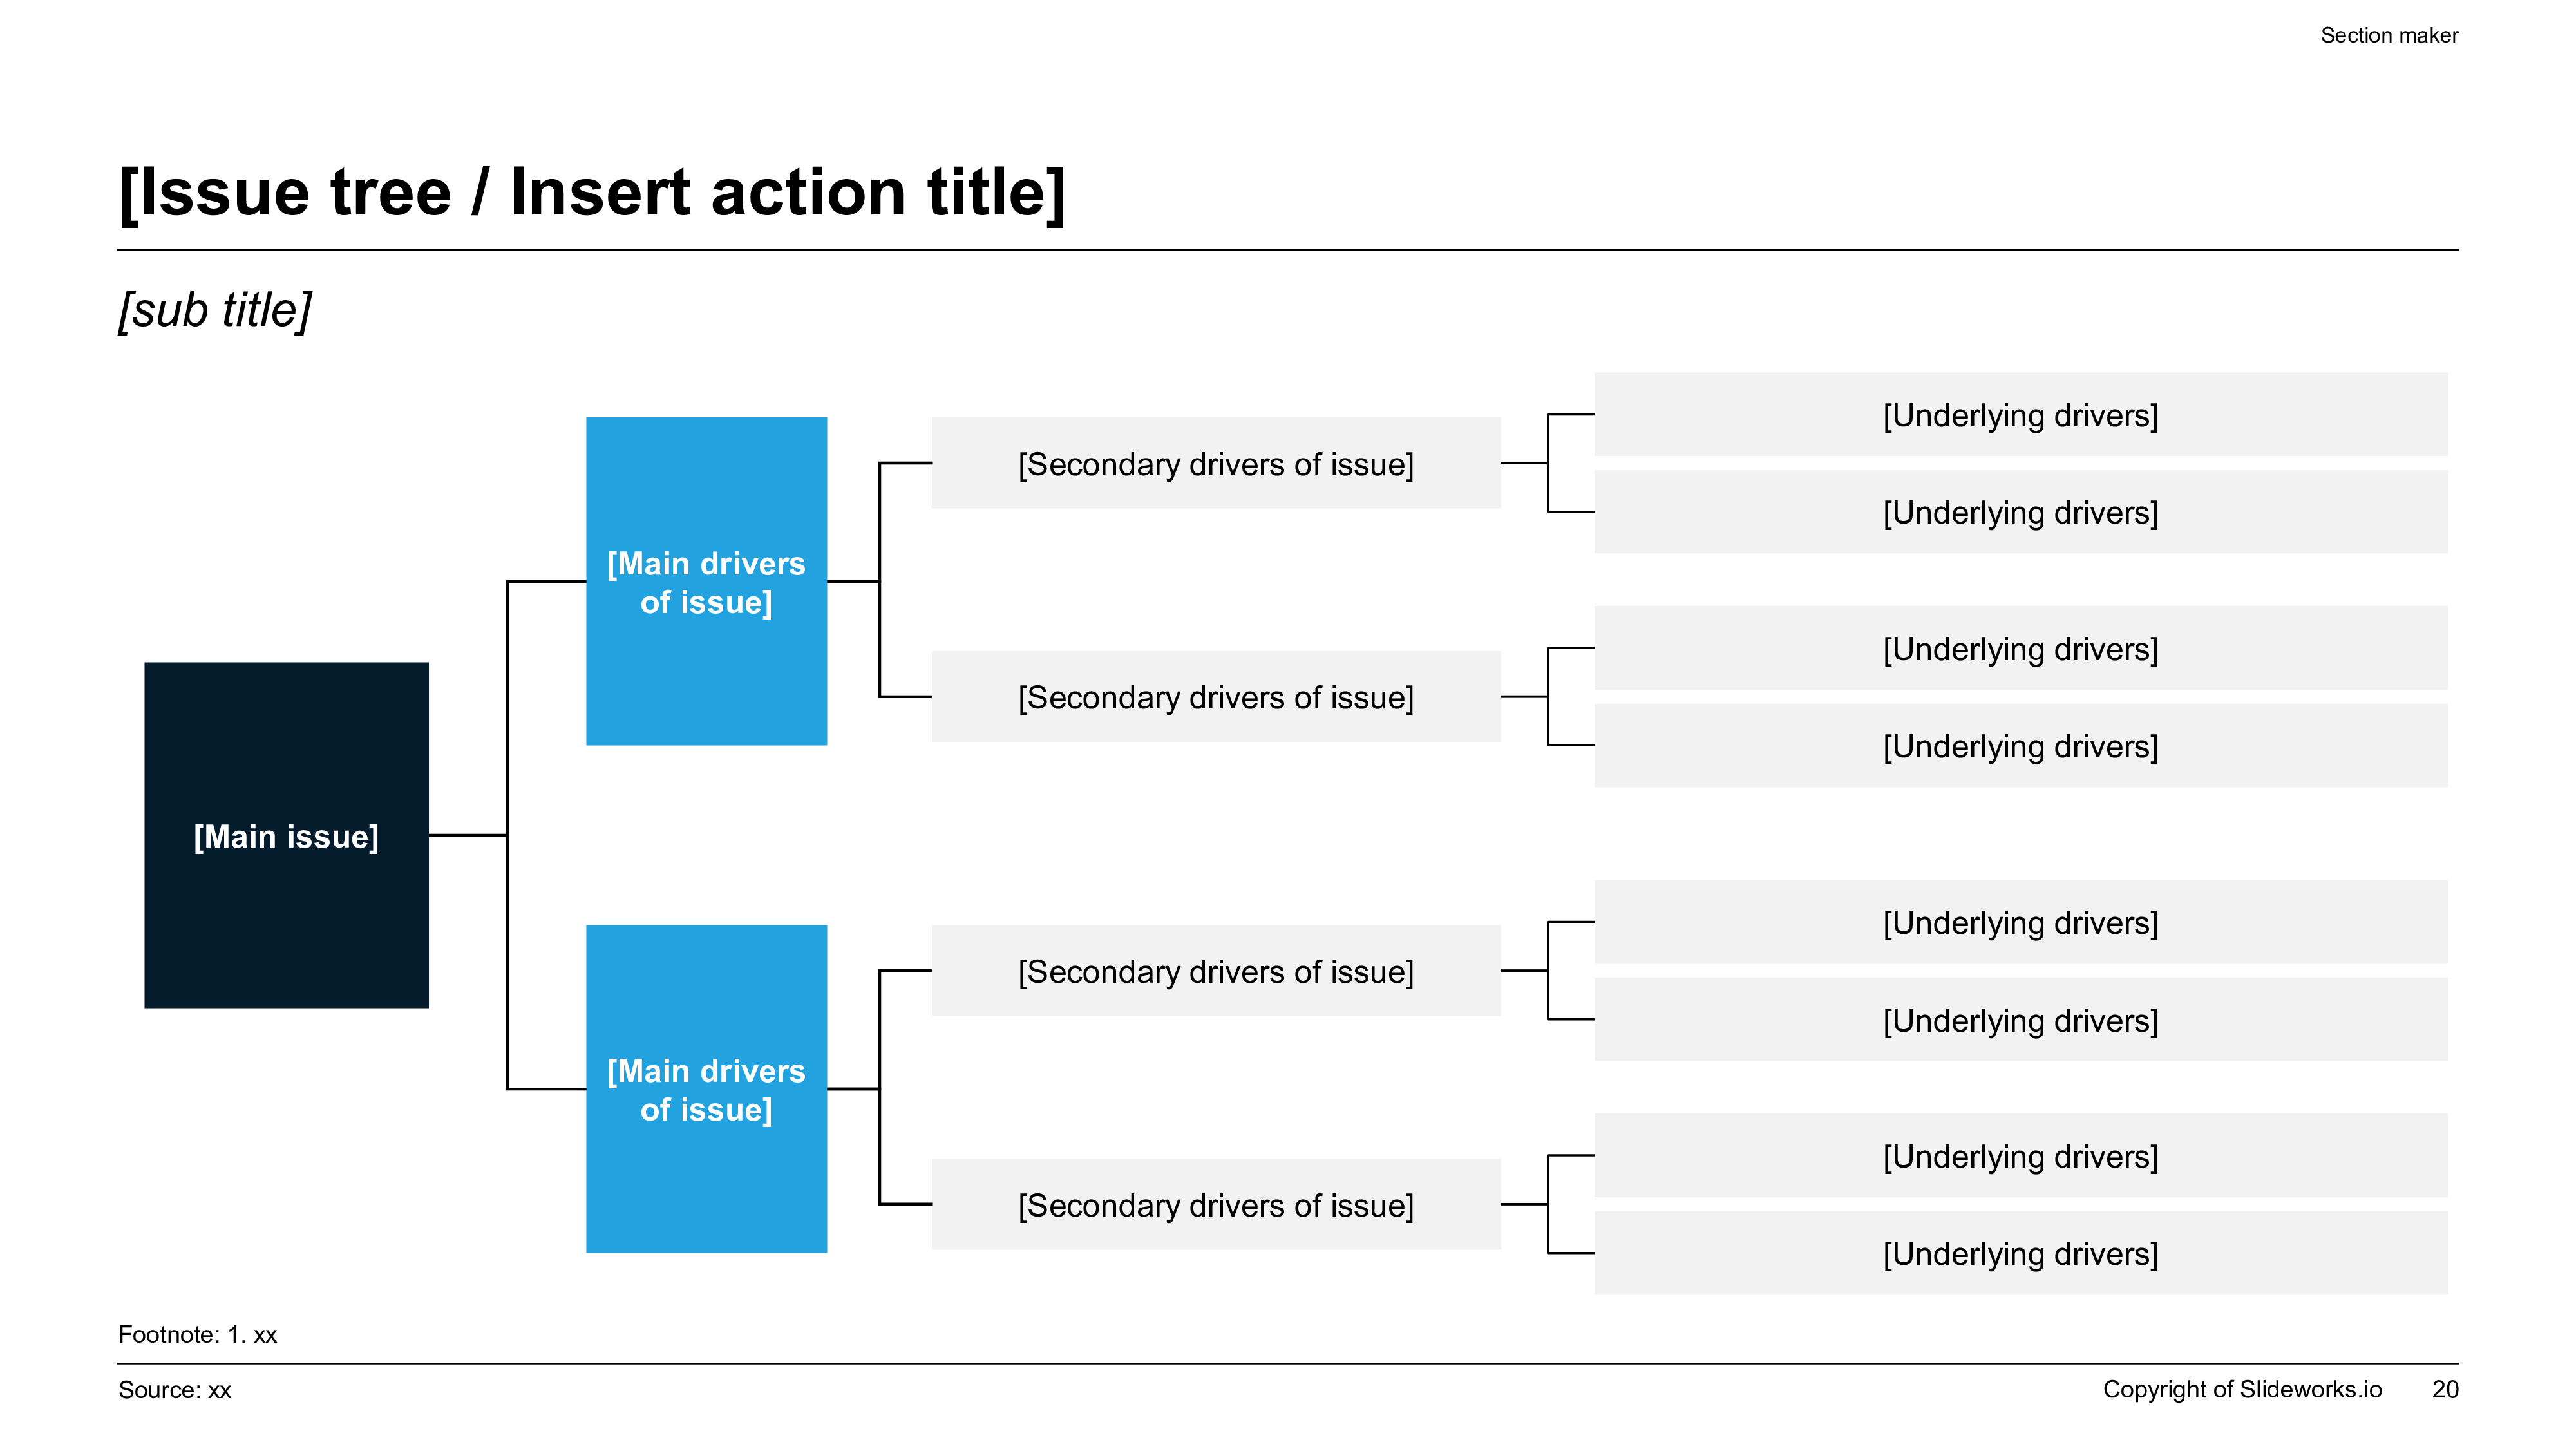
Value Driver Tree Reference
Why Pricing Presentations Often Fail In Executive Reviews
Many pricing decks fail because they confuse analysis with recommendation. They show competitor screenshots, survey snippets, and margin tables, but they never make the actual choice legible. The audience sees a lot of information and still asks the obvious questions: how much should we move price, where should we not move it, what happens to volume, and what exactly do you want us to approve? A pricing presentation that cannot answer those questions is still research, not a decision document.
Another failure mode is using blended averages that hide the important economics. Average price realization, average discount rate, or average gross margin can be directionally useful, but pricing decisions usually live at the segment, product, account, geography, or channel level. If the deck does not separate strategic accounts from long-tail accounts, high-service bundles from simple offers, or renewal motion from new-logo motion, the recommendation will either look too risky or too vague.
The final failure mode is operational naivety. Teams sometimes model an attractive price move but ignore the way it actually lands: quote approval rules, list-price hygiene, rep compensation, contract notice periods, customer-success workload, and whether the field can explain the value story credibly. Senior readers know these details are where pricing programs break. A serious deck therefore needs both the economics and the execution path on the page.
Pricing Fact Pack Required Before Drafting Slides
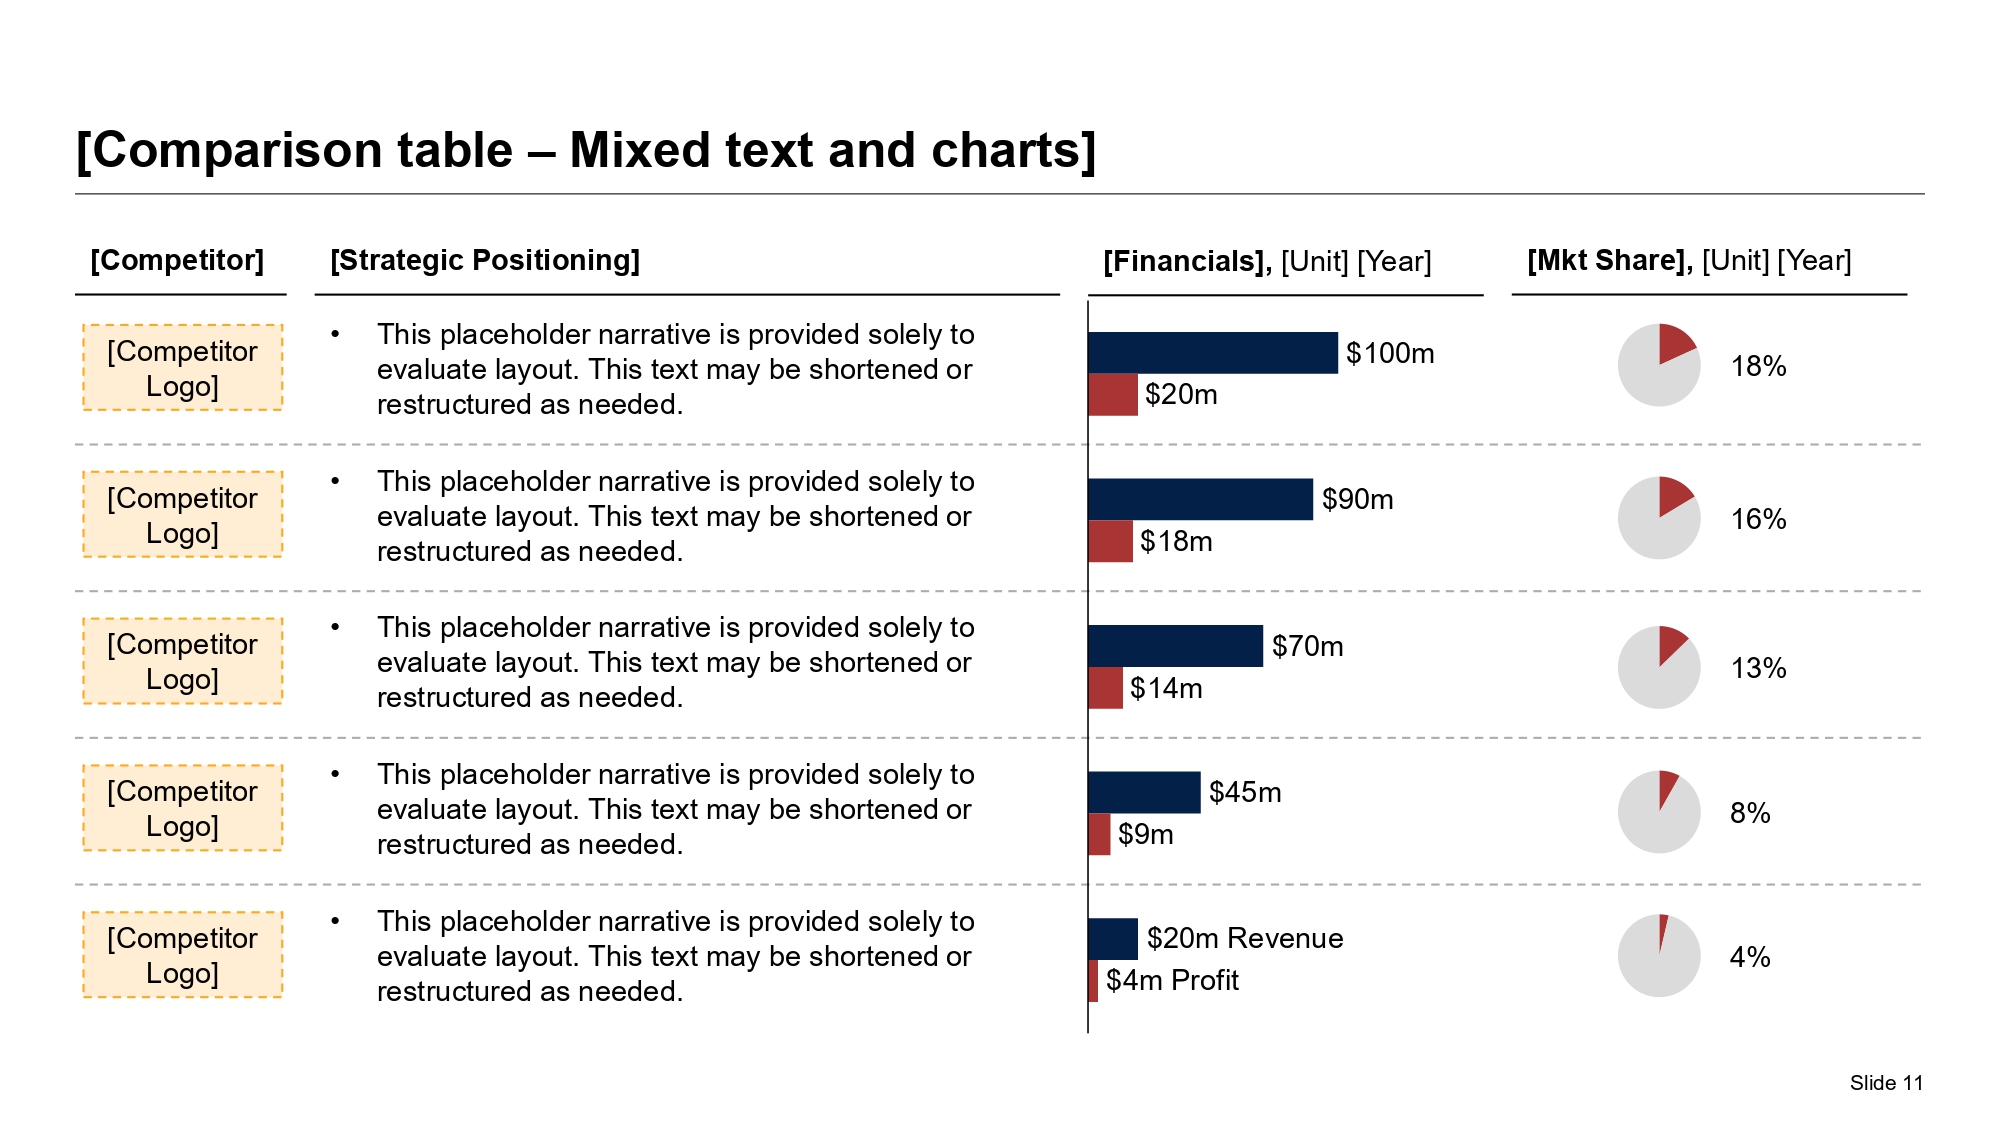
Competitive Pricing Architecture Reference
Recommended 11-Slide Pricing Strategy Presentation Sequence
This sequence works when leadership needs a pricing recommendation they can challenge and approve, not just a market study.
| Slide | Purpose | Executive Question Answered |
|---|---|---|
| 1. Pricing recommendation summary | State the move, the value at stake, and the approval ask in one page | What are you recommending and why now? |
| 2. Current-state economics | Show realized price, discounting, margin pressure, or monetization gap | What is broken in the current model? |
| 3. Segment and customer economics | Separate where pricing power exists from where volume risk is highest | Where can we act without damaging the franchise? |
| 4. Value metric or packaging logic | Explain how the pricing structure should map to customer value and product usage | Is the architecture itself part of the problem? |
| 5. Competitive context | Show relevant peer prices, tiers, or commercial positions | How does our move compare to the market? |
| 6. Scenario economics | Translate price, volume, mix, and cost assumptions into revenue and margin outcomes | What is the upside and what is the downside? |
| 7. Sales and customer implications | Cover objections, exceptions, contract timing, and enablement requirements | What could the field or customer base push back on? |
| 8. Rollout roadmap | Sequence pilots, notices, systems changes, and owner handoffs | How do we execute this safely? |
| 9. Risk and mitigation | Name the assumptions that could break and how the team will respond | What do we watch first if the move slips? |
| 10. KPI scorecard | Define realized price, retention, mix, margin, and exception metrics | How will leadership know the move is working? |
| 11. Decision asks and next steps | Clarify approvals, open questions, and immediate owner actions | What exactly needs to happen after this meeting? |
Prompt Recipe For A Pricing Strategy Presentation
Create an 11-slide pricing strategy presentation for a CEO, CFO, CRO, and strategy audience. Decision needed: approve a targeted repricing and packaging change that improves gross margin without damaging retention in core segments. Use an answer-first executive summary, current-state realized price and discounting baseline, segment economics, competitor and packaging context, value-metric logic, scenario analysis covering price-volume-mix tradeoffs, field and customer implications, rollout roadmap, KPI scorecard, top risks, and explicit decision asks. Write consultant-style action titles, keep the logic MECE, and produce editable PowerPoint-style content rather than decorative AI slides.
Start With Segments, Not A Blended Average Price
The fastest way to weaken a pricing recommendation is to present one company-wide average and call it the answer. Most businesses do not have one pricing problem. They have several smaller ones hiding under the average. Enterprise accounts may tolerate higher price because switching cost is high and the value story is strong. Smaller customers may already be near their willingness-to-pay limit. One product line may be underpriced because implementation has become more expensive. Another may look overpriced only because discount behavior is inconsistent. The deck needs to expose those differences before it recommends a move.
That is why the strongest pricing strategy presentations segment the economics early. The exact segmentation depends on the business, but the principle is stable: show where realized price, margin, churn risk, expansion behavior, service burden, and competitive pressure actually diverge. This helps leaders avoid blunt actions that create headlines without creating value. A five percent list-price increase across the board can look decisive and still destroy more margin than it creates if it hits the wrong accounts or products.
For executive readers, segmentation also improves speed. Instead of asking them to decode a giant data appendix, the deck can say something sharper: enterprise renewals have headroom, SMB self-serve is already priced correctly, and the real leak sits in mid-market exceptions plus legacy bundles. That is a decision-ready statement. It tells leadership where to focus and what to leave alone.
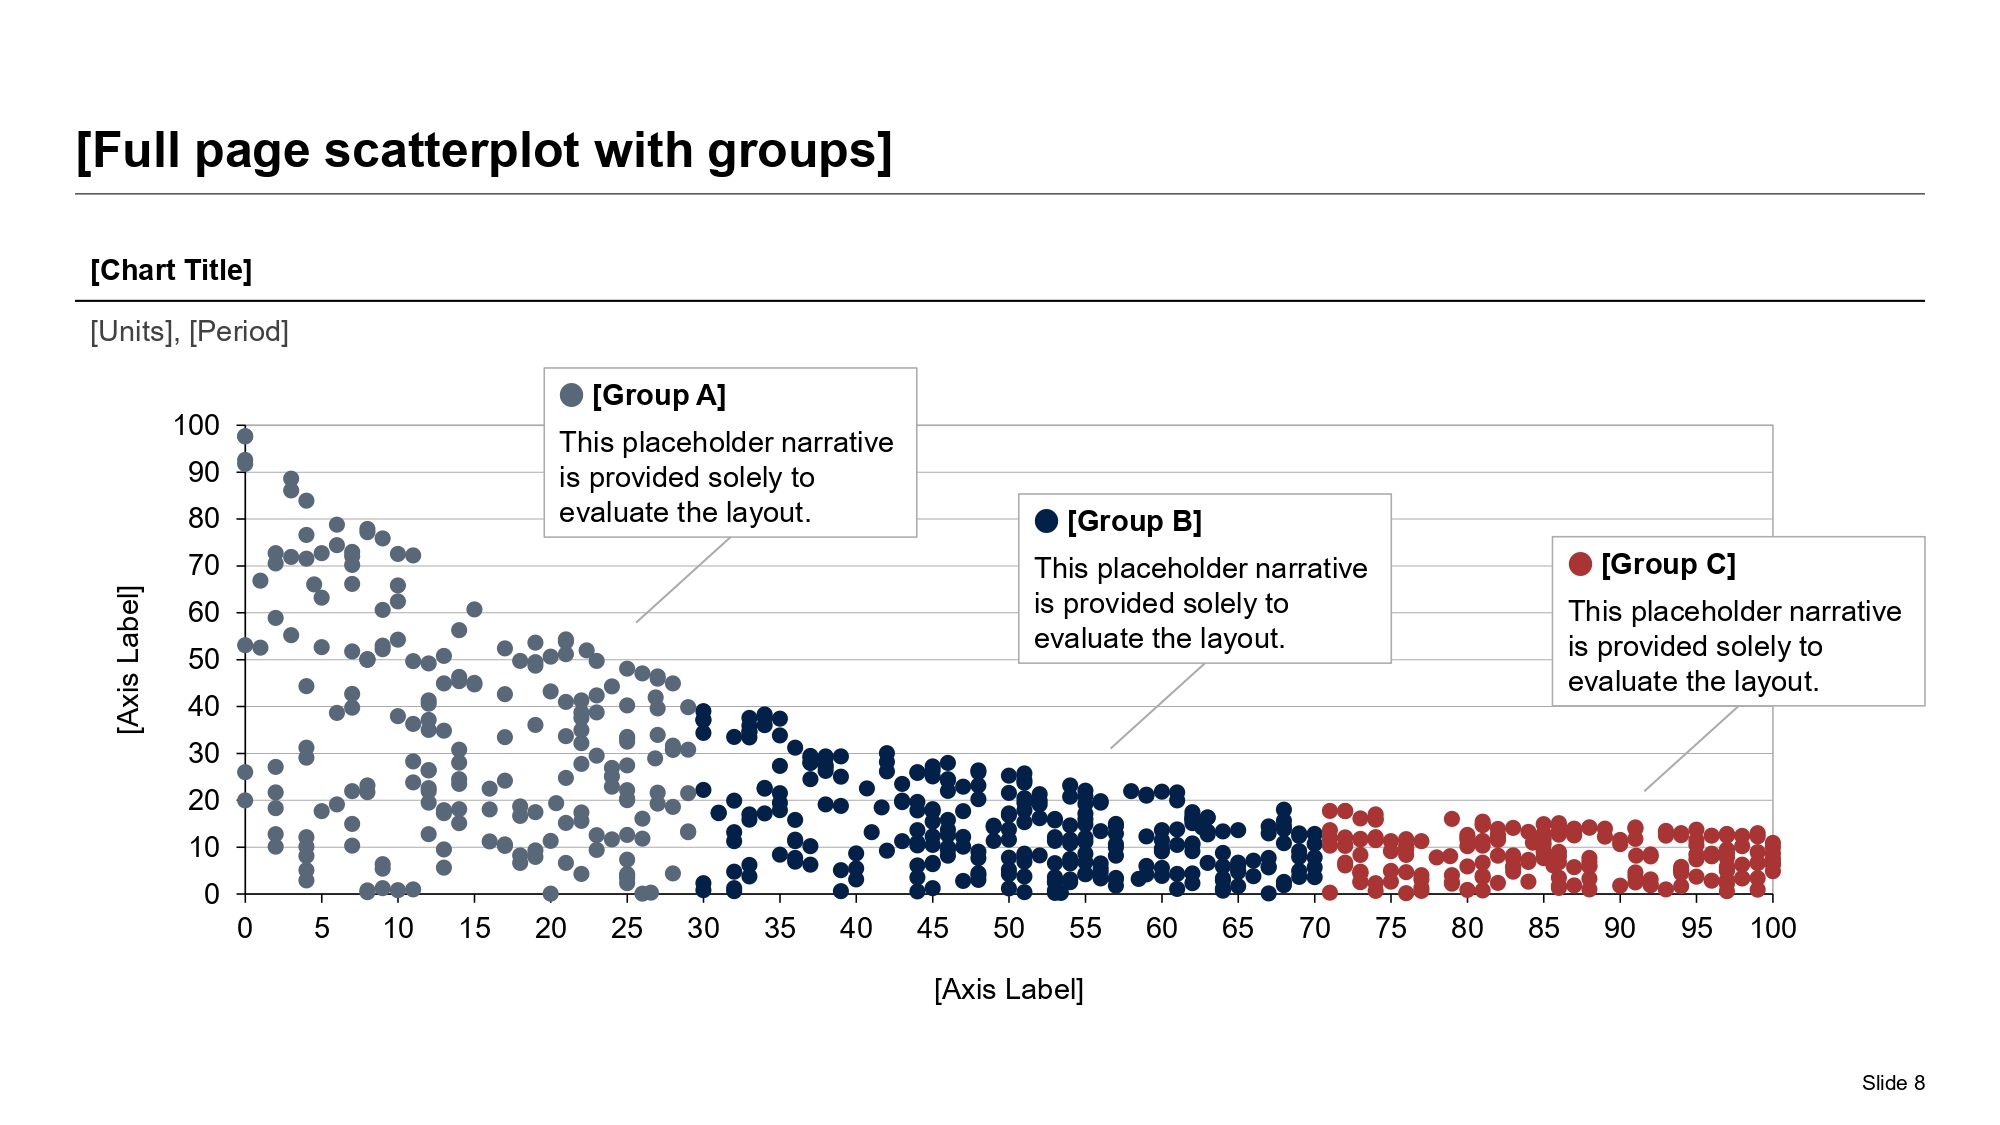
Segment Economics Comparison Reference
Action-Title Rewrite Matrix For Pricing Slides
The title should carry the judgment, not just label the analytical topic.
| Weak Topic Title | Stronger Pricing Action Title | Why The Rewrite Works |
|---|---|---|
| Pricing overview | Most margin recovery sits in mid-market renewals and legacy bundle cleanup, not in across-the-board list increases | It tells the audience where the opportunity is actually concentrated |
| Competitor pricing | Competitors price lower on entry but monetize expansion more aggressively, which supports a simpler land-and-expand architecture | It converts screenshots into strategic implication |
| Volume risk | The downside churn case is manageable if the increase excludes price-sensitive long-tail accounts | It turns a risk topic into a bounded decision statement |
| Packaging | Current bundles hide value and create discount pressure; three cleaner tiers would improve both comprehension and realization | It explains why a packaging change matters financially |
| Implementation | Sales enablement and exception approvals matter more than billing-system changes in the first 60 days | It surfaces the operational bottleneck that leadership should care about |
| Next steps | Approve the pilot segments, discount guardrails, and notice calendar this month to capture the next renewal cycle | It makes the decision ask concrete and time bound |
What Good Pricing Pages Show About Volume Risk, Mix, And Exceptions
A pricing deck becomes credible when it shows that the team understands what can go wrong after the price move, not only what looks attractive in the upside case. Volume risk should not appear as a token one-line sensitivity. It should be connected to customer type, use case, channel, contract posture, and competitive fallback. If all churn risk is shown as a single percentage assumption, the audience has no way to judge whether the downside case is cautious or fictional.
The same applies to mix. Leadership teams often think they are debating price when they are really debating who the business is serving and which products it wants to grow. A pricing move that improves average revenue but shifts the mix toward lower-quality customers or more implementation-heavy deals may not deserve approval. The deck should therefore show whether the recommendation changes the customer mix, package mix, or channel mix and whether that shift is strategically desirable.
Exception behavior is the final blind spot. Many companies do not have a list-price problem; they have an approval-discipline problem. Heavy discounting, free add-ons, nonstandard terms, and weak renewal rules can erase the value of a carefully designed price architecture. Executive readers need to know whether the fix is a price move, a governance move, or both. A useful presentation says that explicitly instead of forcing the audience to infer it from tables.
Executive Review Questions Before Approving A Price Move
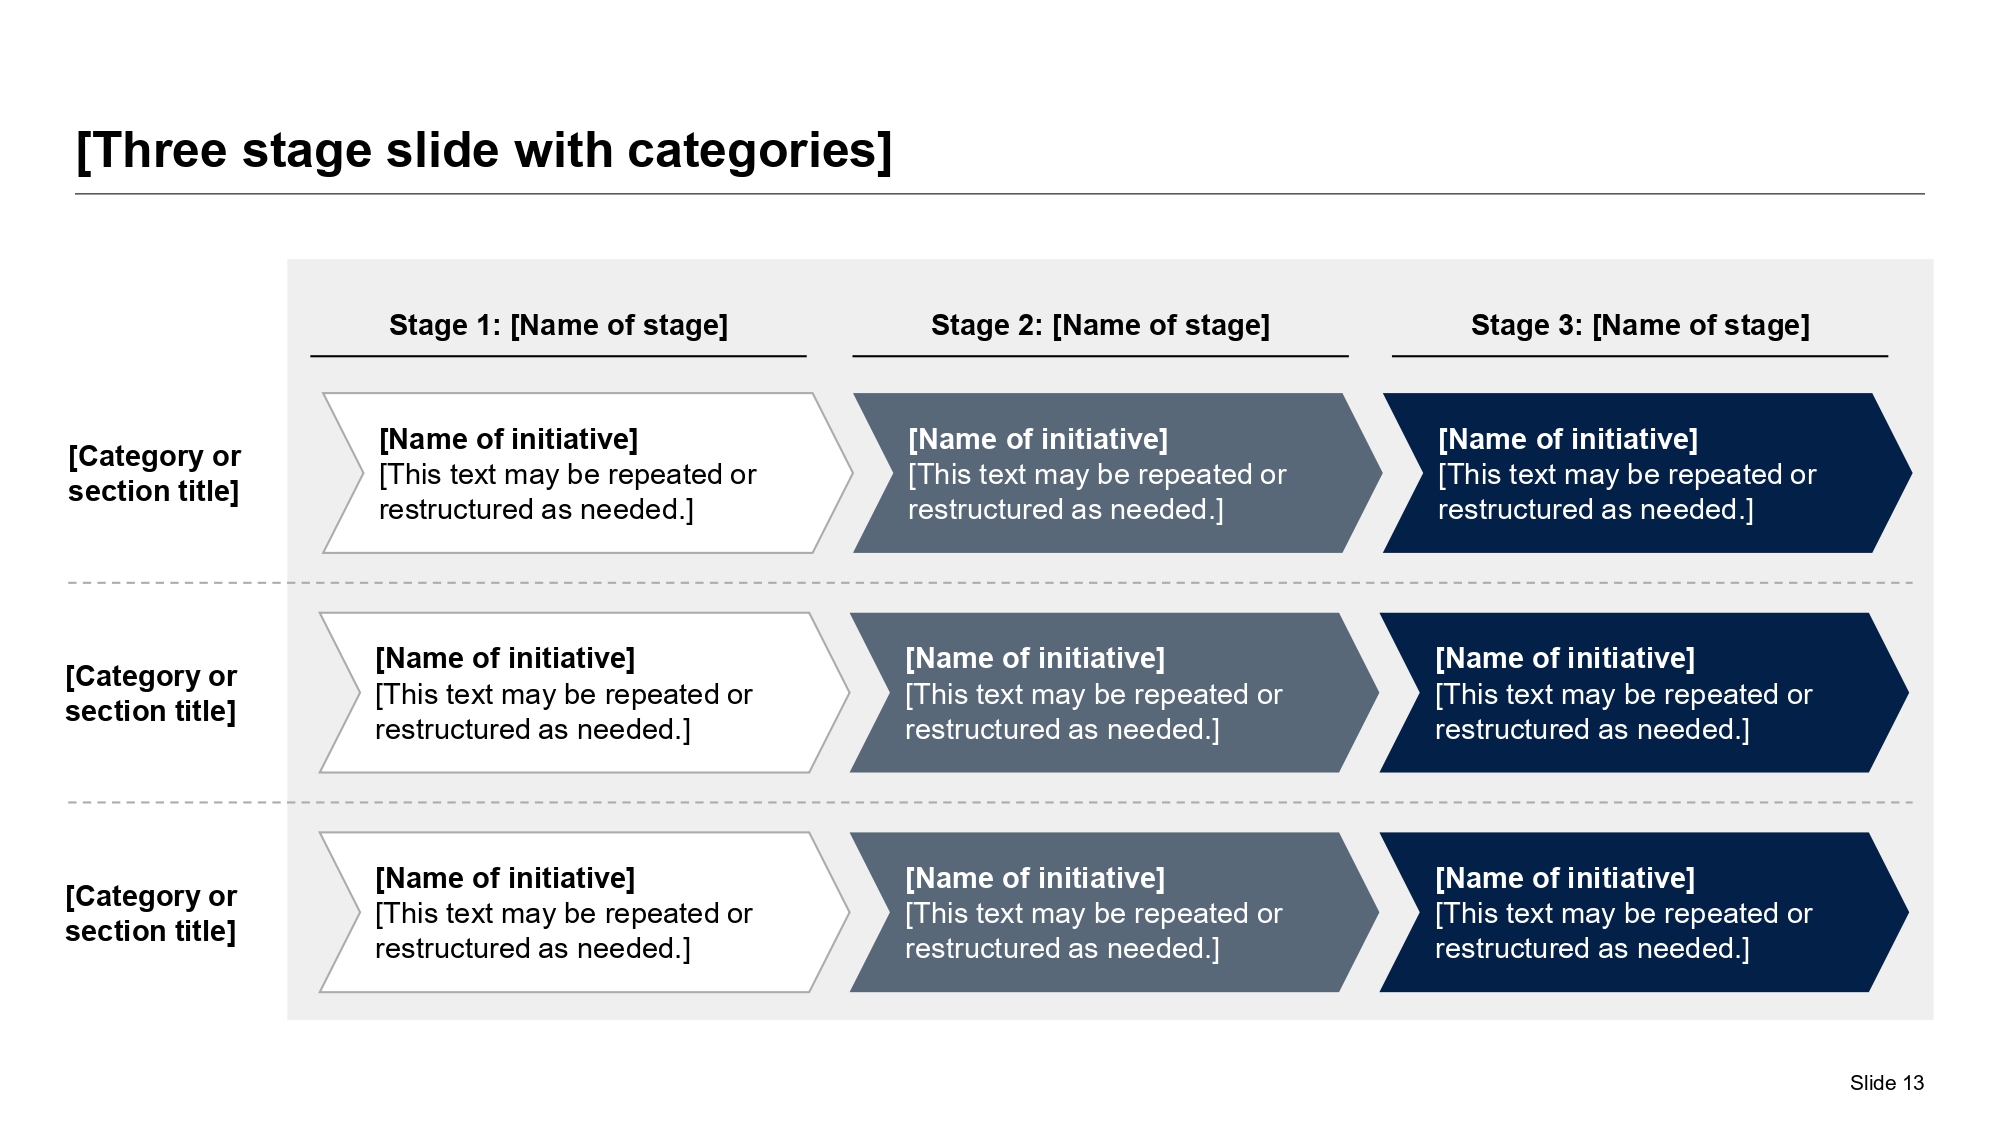
Pricing Rollout Roadmap Reference
Pricing Review Scorecard For CFOs And Revenue Leaders
A pricing deck is stronger when it names the metrics that change management behavior after rollout.
| Metric | Why It Matters | What A Bad Signal Looks Like |
|---|---|---|
| Realized price uplift | Shows whether the move is landing beyond list-price theory | List price rises while realized net price barely moves |
| Discount rate by segment | Separates pricing architecture from approval leakage | The field gives back most of the increase through exceptions |
| Logo retention and renewal rate | Tests whether the value story holds in the market | Retention falls sharply in the very segments targeted for repricing |
| Gross margin by product or package | Confirms that the move improves unit economics rather than only headline revenue | Revenue rises but margin gain is absorbed by service cost or concessions |
| Sales-cycle friction | Shows whether approval rules and customer objections are slowing conversion | Quote approval times and late-stage deal slippage increase materially |
| Mix shift | Reveals whether the recommendation is changing customer or package behavior | The company pushes customers into lower-quality or harder-to-serve mixes |
Build The Recommendation Around The Value Metric, Not Just The Price Point
One reason pricing presentations become shallow is that teams jump to the number before they clarify what the customer is actually paying for. Price per seat, price per user, price per location, price per transaction, fixed project fee, subscription tier, outcome-based fee, or hybrid packaging can each be correct in the right context. The deck therefore needs to show not only the proposed level but also the logic of the value metric itself.
This matters because many monetization problems are architecture problems. If customers are buying one feature but paying through a metric that does not track the value they receive, even a well-calibrated number will create friction. If the package design forces the sales team into custom exceptions every time a customer grows differently than expected, the organization will never realize the intended price. A serious pricing presentation should show whether the business is solving for price level, package design, entitlement logic, or all three together.
For senior readers, the practical question is simple: will this model be easier to explain, defend, and enforce than the one we have today? The deck should answer that with examples. Show how the proposed architecture changes expansion paths, discount behavior, or implementation clarity. That makes the pricing recommendation feel operational instead of theoretical.
Segmented Price Sensitivity Reference
XLSlides Resources For Pricing And Commercial Review Work
Short Answers To Common Pricing Strategy Presentation Questions
What should a pricing strategy presentation include?
At minimum, include the recommendation, current-state pricing problem, segment economics, competitor or value context, scenario analysis, customer and sales implications, rollout plan, KPI scorecard, top risks, and explicit approval asks. If those elements are missing, the deck usually feels descriptive rather than decision ready.
How is a pricing presentation different from a board deck or a business case?
A pricing presentation is narrower and more commercial. It focuses on monetization logic, price-volume-mix tradeoffs, package design, discount discipline, and rollout mechanics. A board deck may include pricing as one issue among many, and a business case may cover broader investment tradeoffs beyond monetization.
Should a pricing deck show competitor prices?
Usually yes, but only when the comparison is relevant to the decision. Show the competitor architecture, not just screenshots. The point is to explain how the market frames value and where your commercial move will feel premium, parity, or defensive.
Can AI create a credible pricing strategy presentation?
Yes, as a drafting layer. AI is useful for organizing inputs, structuring the slide sequence, rewriting action titles, drafting tables, and turning fragmented analysis into a first narrative. Human leaders still need to validate assumptions, customer implications, and the final approval ask.
Build The First Pricing Strategy Deck In XLSlides
Use XLSlides to turn pricing analyses, segment economics, competitor notes, discount data, and executive comments into an editable pricing strategy presentation with action titles, scenario logic, rollout structure, and a clearer approval path.
Generate Pricing Deck