Executive Summary: The Boardroom Mandate for Scientific Human Capital Strategy
Key Takeaways: Core Principles of Board-Level Human Capital & Talent Strategy Presentations
Human Capital & Workforce Strategy Scorecard: Baseline vs. Target State Economics
Headcount Financial Architecture: Translating Strategic Intent into Quantified Payroll Economics
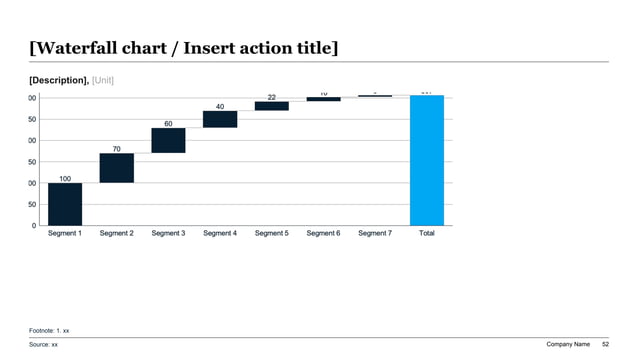
Exhibit 1: Headcount Economics & Personnel Cost Waterfall Bridge
Strategic Workforce Planning: Engineering the 3-Year Capability Supply-Demand Equation
Exhibit 2: Strategic Workforce Planning 3-Year Capability Gap Matrix
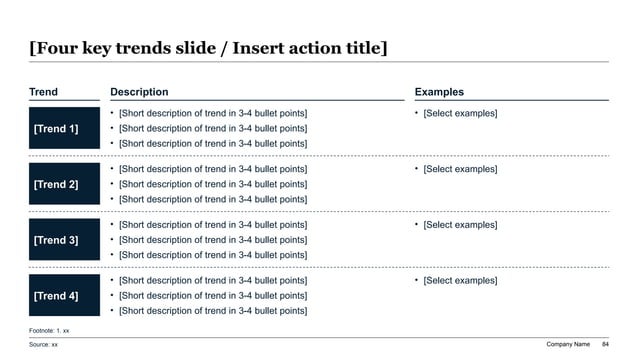
The 4B Sourcing Framework: Evaluating Build, Buy, Borrow, and Bot Pathways
The 10-Point Strategic Workforce Planning Governance Checklist for CHROs
The 9-Box Talent Review: Objective Calibration vs. Subjective Manager Inflation
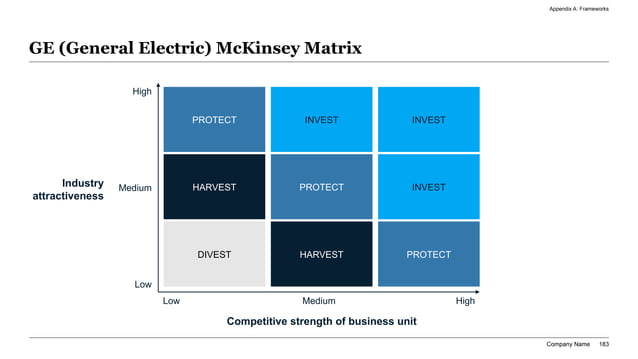
Exhibit 3: The 9-Box Talent Review Grid & Executive Calibration Matrix
Deconstructing Performance vs. Potential: Standardizing Evaluation Criteria Across Divisions
The 9-Box Talent Calibration Matrix: Action Standards, Rewards, and Development Mandates
Retention Telemetry: Dissecting the Economics and Root Causes of Regrettable Attrition
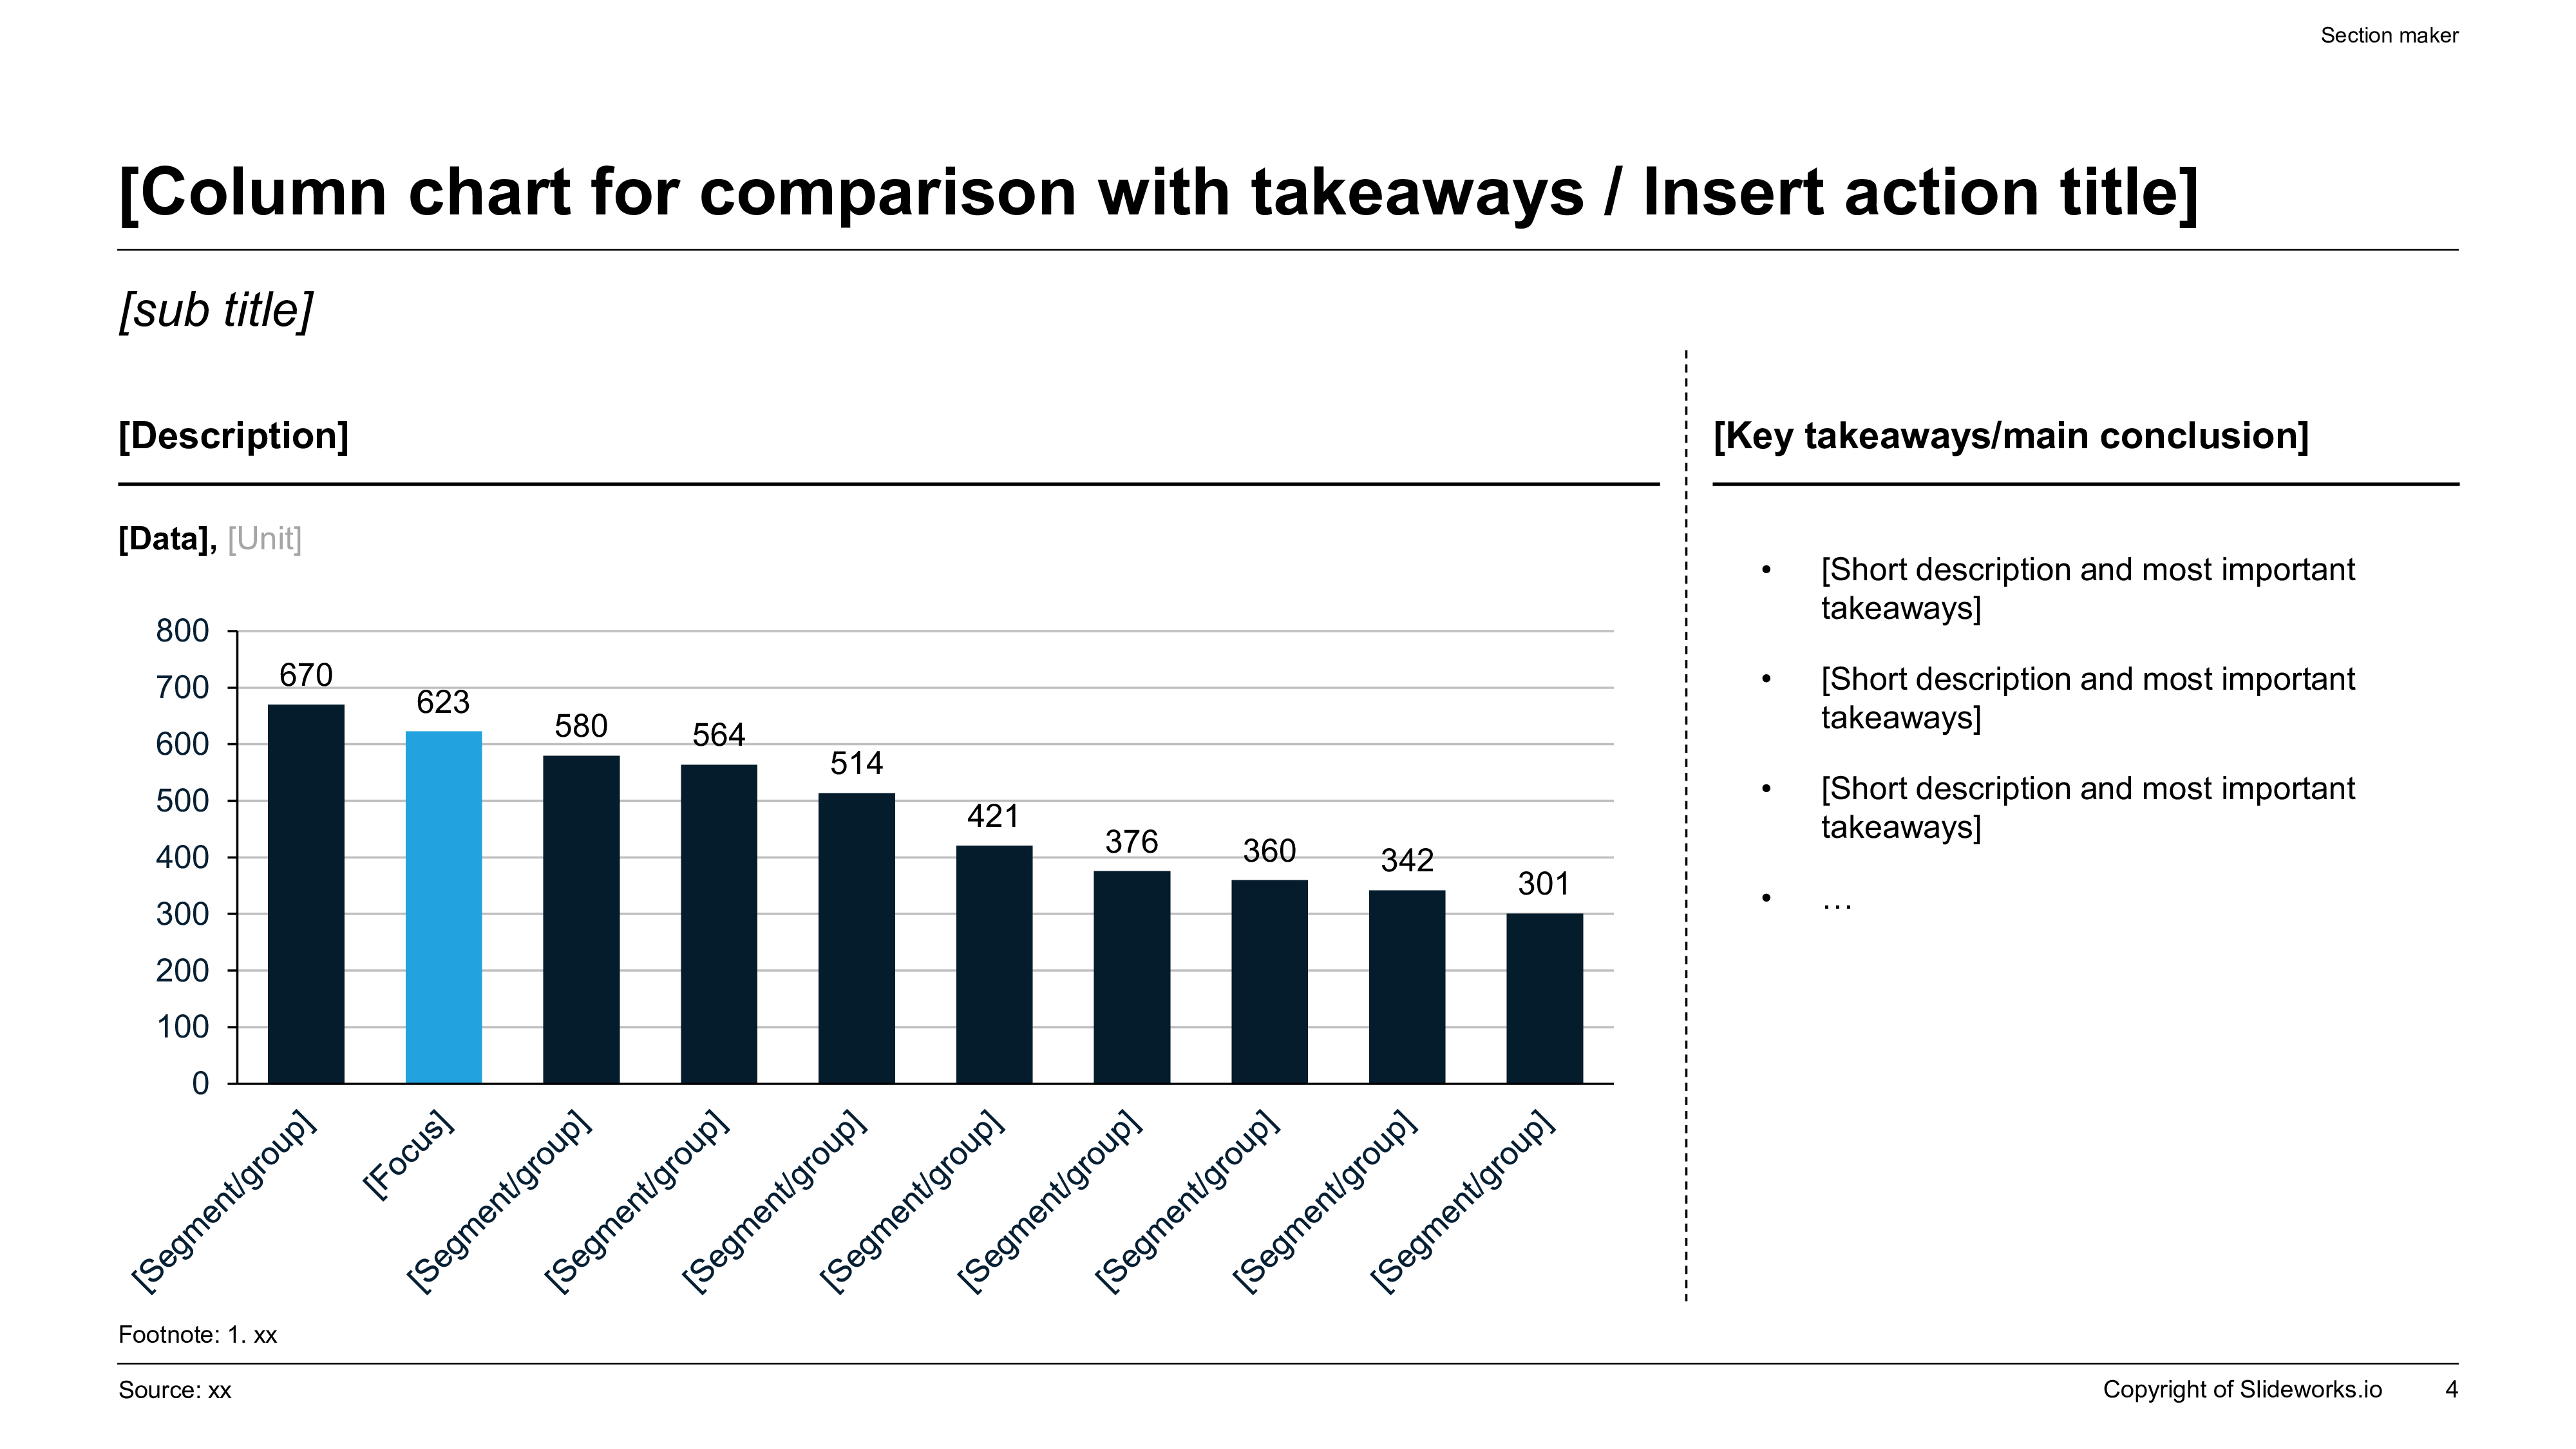
Exhibit 4: Retention Telemetry & Regrettable Attrition Pareto Diagnostic
Calculating the Fully Loaded Cost of Talent Loss: Beyond Recruiting Fees
Regrettable Attrition Financial Impact Model & Targeted Retention Interventions
Leadership Succession Depth: Mitigating Single-Point Failure Risks in Mission-Critical Roles
Exhibit 5: Executive Succession Depth & Critical Role Bench Strength Architecture
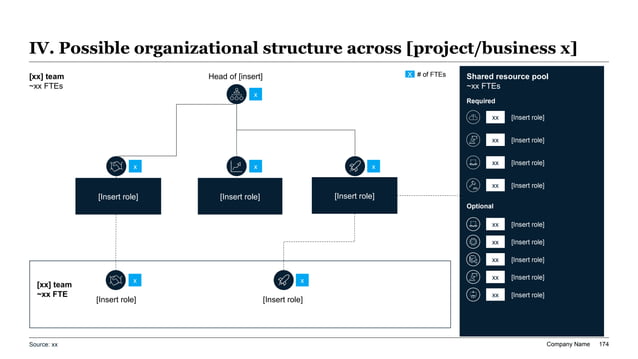
Dual-Track Succession Governance: Emergency 24-Hour Coverage vs. 3-5 Year Orderly Pipelines
The Pre-Board Human Capital Committee Review Checklist
Structuring the Boardroom Deck: The 8-Slide Executive Human Capital Narrative Architecture
XLSlides System Prompt Recipe: Generating Board-Ready Human Capital & Talent Strategy Decks
Act as a Senior Partner in McKinsey's People & Organizational Performance Practice and an expert executive presentation designer. Generate an institutional, decision-ready 8-slide Human Capital & Talent Strategy board presentation deck based on the following enterprise input data: [ENTERPRISE HUMAN CAPITAL CONTEXT] - Company Name: Nexus Enterprise Technologies (Global B2B Software Platform) - Total Headcount: 1,150 FTEs growing to 1,240 FTEs over 24 months - Current Fully Loaded Payroll: $142.5M; Target Payroll Envelope: $156.8M - Current Revenue Per Employee: $385.2k; Target Revenue Per Employee: $440.5k - Primary Capability Deficits: AI/ML Engineering (+45 FTEs), Enterprise Cloud Architecture (+30 FTEs), Cyber Resilience (+15 FTEs) - Current Regrettable Voluntary Attrition: 14.2% among top-tier talent; Target Attrition: <6.5% - Current Average Span of Control: 1:4.2; Target Rebalanced Span: 1:7.4 (eliminating 45 manager-of-one roles) - Critical Role Succession Coverage: 1.1:1 current; Target: 2.6:1 bench strength ratio across top 35 enterprise roles [EXECUTIVE PRESENTATION DESIGN REQUIREMENTS] 1. Executive Slide Tone: Write in crisp, authoritative, board-level prose. Avoid generic HR marketing platitudes and vague emotional appeals. Use quantified financial and operational metrics throughout. 2. Declarative Action Titles: Every slide must feature an assertive, complete-sentence action title (e.g., "Strategic Workforce Realignment Expands Revenue-Per-Employee by 14.4% While Liberating $4.2M in G&A Span-of-Control Savings"). 3. Slide Structure (8 Slides): - Slide 1: Executive Title & Strategic Human Capital Mandate - Slide 2: Headcount Economics Waterfall Bridge (reconciling starting payroll to ending underwritten capacity) - Slide 3: 3-Year Strategic Workforce Planning Demand-Supply Capability Matrix - Slide 4: 4B Sourcing Optimization Framework (Build, Buy, Borrow, Bot) - Slide 5: Calibrated 9-Box Performance vs. Potential Matrix with Guideline Quotas - Slide 6: Regrettable Attrition Pareto Root-Cause Diagnostic & Cost-of-Turnover Model - Slide 7: Critical Role Succession Depth & Leadership Continuity Scorecard (2.5:1 Coverage) - Slide 8: Governance Approvals, Incentive Plan Reallocations & 100-Day Execution Roadmap 4. Visual Layout Standards: Structure slides with high information density, utilizing split-panel executive summaries, structured comparison tables, Harvey Ball competency scorecards, and formatted financial metric callout cards.
Frequently Asked Questions About Human Capital & Talent Strategy Presentations
How should a CHRO address board pushback regarding forced 9-box distribution guidelines?
Frame forced or guideline distributions not as a punitive bureaucratic quota, but as a fiduciary calibration mechanism that protects company capital and ensures meritocratic fairness. Emphasize that in uncalibrated evaluations, manager grade inflation inevitably dilutes reward pools, causing true top-tier performers (Stars) to be under-compensated and targeted by competitor headhunters. Presenting historical data showing that 75%+ of employees were previously rated "exceeds expectations" demonstrates why calibration is essential to preserve incentive integrity and allocate scarce development resources where they generate the highest shareholder return.
What is the most effective way to calculate and present Revenue Per Employee to an executive committee?
Present Revenue Per Employee as an operating leverage trajectory rather than a static snapshot. Calculate it as total annual enterprise revenue divided by average full-time equivalent headcount (FTEs). Benchmark this figure against public peer competitors and upper-quartile industry averages. Crucially, show the delta between revenue growth percentage and headcount growth percentage: when revenue expands by 18% while headcount expands by only 5%, revenue-per-employee expands dramatically, proving that capital investments in technology, tooling, and workflow automation are delivering authentic non-linear labor productivity.
How do you handle underperformers (Box 1) without damaging overall organizational morale?
Transparency, speed, and managerial accountability are paramount. Underperformers who linger in organizations demoralize high performers who are forced to carry their unfinished workloads. In the human capital deck, outline a rigorous, compassionate 30-to-60-day Performance Improvement Plan (PIP) governance process with objective, binary pass/fail milestones. Emphasize that treating underperformers with professional dignity, fair severance packages, and swift resolution signals to high performers that the organization upholds high standards of excellence and values their contributions.
How can an enterprise accurately quantify the financial impact of employee retention programs?
Deploy a fully loaded Cost-of-Turnover model that calculates the comprehensive replacement cost (1.5x to 2.5x base salary) across direct search fees, executive interviewing hours, vacancy coverage, and new-hire ramp productivity loss. Compare the total economic loss of historical regrettable turnover against the targeted cost of retention interventions (e.g., spending $1.2M on off-cycle retention equity refreshes and career pathing to prevent 18 high-performer departures represents a direct economic savings of $8.5M, validating a 7.1x return on invested capital).
What are the most common mistakes made in executive succession planning decks?
The three most critical mistakes are: (1) Relying on "paper succession plans" that list names without active development plans or validated readiness; (2) Confining succession to C-suite roles while ignoring technical or operational Single-Point Failure Roles whose vacancy would paralyze operations; and (3) Failing to establish an Emergency 24-Hour continuity protocol with legal signatory authorities, creating severe corporate vulnerability in the event of an unexpected crisis.
How should contingent workers, contractors, and agency staff be represented in human capital presentations?
Never exclude contingent labor from workforce strategy presentations. Present a dedicated "Total Workforce Architecture" slide or exhibit that reconciles internal FTEs alongside external contractors, statement-of-work (SOW) consultants, and agency staff. Compare fully loaded hourly rates of contractors against internal employee compensation, and highlight opportunities where converting long-term contractors into full-time employees liberates 20% to 35% in premium agency markups while securing vital institutional knowledge.
How does modern AI tooling like XLSlides enhance the human capital strategy workflow?
Human capital leaders frequently waste hundreds of hours manually formatting PowerPoint slides, copy-pasting numbers from spreadsheets into fragmented text boxes, and re-drawing organizational charts. XLSlides enables CHROs, people analytics teams, and strategy consultants to input structured workforce datasets, financial waterfall reconciliations, and succession rosters, automatically generating boardroom-ready, consulting-grade widescreen presentations with perfect margin alignment, professional typography, and defensible action titles in seconds.