Professional Market Sizing & Analysis Slide Templates

Stop wasting hours on manual formatting. Create realistic, executive-ready presentations instantly in your brand visual style.

Nested TAM/SAM/SOM visualizations
Industry growth projections
Competitor landscape mapping

1What is Market Sizing and Analysis?

Market Sizing and Analysis is a foundational strategic exercise that defines the boundary and economic viability of a business opportunity. In top-tier corporate strategy and venture capital, this analysis serves as the quantitative bedrock for all capital allocation decisions. Far from being a simple mathematical projection, a professional market analysis translates unstructured demographic, economic, and behavioral data into a structured narrative. It maps out the total revenue potential available to a company, aligning leadership teams on the exact scale of the prize. Under standard MECE guidelines, a robust market sizing deck dissects a broad industry into addressable segments, highlighting growth drivers, adoption curves, and potential bottlenecks. When presenting to board members or investment committees, the clarity of this analysis determines whether a project receives funding or is shelved. By using structured slide layouts and clear data visualizations, strategy teams can communicate the commercial feasibility of new ventures, providing the objective evidence needed to support high-stakes strategic choices.
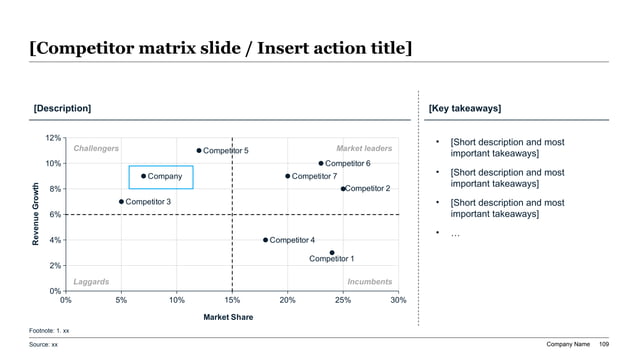
Split presentation template showing a 2x2 competitive quadrant plot with Challengers, Market Leaders, Laggards, and Incumbents on the left, with key text takeaways on the right.
Template Design LayoutProfessional Market Sizing & Analysis Slide Templates

2Ideal Audience: Who is this template built for?

This template is explicitly designed for high-intent corporate professionals and founders who need to present rigorous, data-driven market evaluations. The primary users include Chief Strategy Officers (CSOs), Vice Presidents of Corporate Development, Management Consultants, Product Directors, and Startup Founders seeking venture backing. These elite business leaders present to highly analytical audiences, such as board directors, venture capital general partners, and corporate investment committees, who demand extreme structural discipline and factual authority. A strategy director at a Fortune 500 company uses this framework to justify expanding into adjacent geographic territories or launching new product lines. Similarly, a venture-backed tech founder utilizes this structured layout to showcase market scale and customer LTV potential to institutional investors. By eliminating standard layout drift and manual alignment tasks, this template enables strategy teams to focus entirely on unit economics and competitive advantages, presenting their findings with the exact visual polish expected by McKinsey and BCG partners.

3Practical Use Cases: When and where to deploy this deck

The strategic relevance of the Market Sizing & Analysis framework applies across several critical milestones in a company's growth trajectory. Key deployment scenarios include fundraising pitch sessions (from seed rounds to late-stage Series C), annual corporate strategy planning, corporate development due diligence, and go-to-market (GTM) launch reviews. During investor fundraising pitches, the deck is critical to prove the scalability of the business model, showing venture capital partners that the startup operates in a massive, high-growth addressable market. For corporate mergers and acquisitions (M&A), corporate development teams deploy these layouts to model market synergies and calculate potential post-merger revenue capture. During internal business planning, product management leads use this presentation to justify resource allocation and budget increases for new feature development based on addressable user segments. Employing this structured, high-contrast visual blueprint ensures that your recommendations are received as authoritative corporate assets, accelerating decision-making speed and transaction velocity. It provides the empirical foundation that executive leadership needs to commit financial capital with high confidence, ensuring complete operational alignment and rapid strategy execution across all functional units.

4TAM, SAM, and SOM: Breaking down the core frameworks

To build credibility and pass due diligence, a market sizing presentation must break down the market opportunity into three standard nested segments: Total Addressable Market (TAM), Serviceable Addressable Market (SAM), and Serviceable Obtainable Market (SOM). The TAM represents the entire global market demand for a product or service. The SAM defines the portion of the TAM that is targeted by your product and within your geographic reach. The SOM represents the highly realistic share of the SAM that your business can realistically capture within the next 24 to 36 months, accounting for competition and sales capacity. Structuring your slides around this cascade proves to investors that your growth projections are grounded in operational reality rather than optimistic speculation. Below is a high-density comparison of these core parameters:

MetricScope of EstimationPrimary Focus in Strategy
Total Addressable Market (TAM)Global market demandLong-term theoretical ceiling
Serviceable Addressable Market (SAM)Regionally targeted portionMedium-term business model fit
Serviceable Obtainable Market (SOM)Capture-ready target shareShort-term sales execution plan

By analyzing these segments sequentially, strategy teams can establish a clear roadmap for customer acquisition and market penetration, ensuring absolute strategic clarity.

5Aesthetics & Design Rationale of the mckinsey-blue Theme

The visual layout of this template follows the strict corporate design standards pioneered by top-tier global consulting firms. Utilizing our custom 'mckinsey-blue' theme, the deck establishes instant executive authority through high-contrast typography, rigorous grid alignment, and generous whitespace. Widescreen 16:9 proportions are enforced across all cards to ensure a premium visual experience on high-resolution displays and modern boardroom projectors. The visual hierarchy utilizes a strict color distribution model: a dominant 60% background canvas, a 30% structural container layout, and a 10% high-contrast accent blue to guide the viewer's eye to key metrics and growth indicators. Contrast ratios exceed 4.5:1, ensuring absolute readability and accessibility under any presentation lighting. Rather than cluttering slides with decorative shapes or low-quality clip art, this design system protects at least 30% negative space on every slide, allowing your TAM metrics and competitive charts to breathe, reducing cognitive load, and keeping the focus entirely on your core strategic recommendations.

6Storylining & Narration: The Minto Pyramid Principle

Executive-level presentations are won or lost on narrative flow and logical clarity, not raw data dumps. To ensure your market sizing deck commands boardroom attention, you must structure your story around Barbara Minto's legendary Pyramid Principle. This communication discipline requires that you lead with the conclusion first: every single slide title must be written as an active, conclusion-focused headline rather than a passive category label. For example, instead of a slide titled 'Our Addressable Market,' write an active headline like 'Our TAM reached $4.2B in 2026, driven by rapid cloud adoption.' Furthermore, all supporting data points, lists, and charts must serve as MECE sub-arguments that validate that primary headline. Ideas must flow in chronological, structural, or comparative order to ensure a seamless widescreen narrative. This strategic storylining ensures that a busy VC partner or CEO can scan your entire deck in under two minutes and fully grasp the complete commercial opportunity.

7Integrating Porter's Five Forces and Competitive Matrix

A comprehensive market sizing deck is incomplete without a clear assessment of the competitive landscape. To prove market defensibility, this template integrates a 2x2 competitive quadrant plot and a structured analysis of Porter's Five Forces. The competitive matrix visually categorizes industry players into four distinct groups: Challengers, Market Leaders, Laggards, and Incumbents, based on their completeness of vision and ability to execute. By mapping your startup or business unit relative to these competitors, you can clearly demonstrate your unfair operational advantage or technological moat. Simultaneously, evaluating Porter's Five Forces—threat of new entrants, bargaining power of buyers, bargaining power of suppliers, threat of substitute products, and industry rivalry—proves that your business model can withstand external market pressures and regulatory shifts. This dual analytical approach demonstrates deep market research, showing investment committees that your market expansion plan is backed by systematic due diligence and rigorous commercial planning. Ultimately, this comprehensive competitive overview allows your strategy leads to articulate a defensive growth pathway, establishing immediate trust with conservative board members and risk-averse institutional investors.

8Slide-by-Slide Outline for a Winning Market Analysis Deck

To achieve maximum impact and secure investor alignment, a professional market analysis presentation should follow a logical, narrative-driven 10-slide outline:

- Slide 1: Executive Title & Hook — Establishing the core thesis and market opportunity.

- Slide 2: Strategic Context — Background on macro-economic shifts and customer pain points.

- Slide 3: TAM/SAM/SOM Sizing Cascade — Nested visual representation of addressable segments.

- Slide 4: Industry Growth & CAGR Projections — Widescreen charts showing market acceleration.

- Slide 5: Competitor Landscape Matrix — Visual 2x2 quadrant mapping key industry players.

- Slide 6: Customer Segmentation Analysis — Detailed vertical profiles of core buyers.

- Slide 7: Go-to-Market Strategy — Phased plan to capture the target SOM segment.

- Slide 8: Financial Feasibility & Unit Economics — EBITDA, LTV/CAC, and gross margin projections.

- Slide 9: Risk Mitigation & Entry Barriers — Evaluating Porter's forces and regulatory compliance.

- Slide 10: Conclusion & Next Steps — An active call-to-action driving commitment.

Following this outline ensures all strategic dimensions are addressed with absolute clarity.

9Copy-Pasteable Prompt Engineering Recipe for Slide Generation

To help strategy leads and founders generate high-impact presentations instantly, our advanced generative models support structured prompt recipes. By feeding a highly descriptive, context-rich brief into the AI generator, you can bypass hours of manual slide drafting and formatting debt. Our AI understands structured corporate syntax and automatically converts textual requirements into visual slide elements like nested circles and quadrant grids. This allows business analysts to generate high-fidelity, client-ready presentations without wasting time on pixel alignments. Below is a highly optimized, copy-pasteable prompt engineering recipe tailored for this specific market sizing template:

```text

Create a professional market sizing and analysis presentation for a new enterprise SaaS platform. Enforce a strict MECE framework. The deck must include a nested TAM/SAM/SOM slide, a 5-year CAGR growth projection chart, and a 2x2 competitive landscape quadrant. Use the mckinsey-blue color scheme with perfect 12-column grid alignments.

```

Using this prompt ensures the AI understands the required structural constraints, automatically mapping your business context to appropriate layouts like nested circles and comparison tables. It eliminates formatting drag, delivering a boardroom-ready widescreen PPTX file in under 60 seconds. This capability allows strategy partners to iterate rapidly, adjust baseline financial assumptions dynamically, and compile highly refined client deliverables on the fly, saving hours of visual manual work while ensuring that all branding elements remain fully compliant with strict corporate design guidelines.

10Performance Comparison: Manual Design vs. XLSlides AI Automation

Transitioning from manual slide creation to automated AI generation represents a massive operational multiplier for strategy and corporate planning teams. Traditionally, building a structured market sizing deck in PowerPoint requires 8 to 12 hours of tedious manual formatting, dealing with misaligned shapes, font drift, and manual chart plotting. In contrast, XLSlides AI delivers a pixel-perfect, boardroom-ready widescreen deck in under 60 seconds. Our advanced layout engine enforces absolute grid precision, automatically locking typography and margin configurations to professional corporate standards. Below is a structured comparison of the two workflows:

- Average Time Invested: 10 hours manually versus 60 seconds total with XLSlides AI.

- Grid Alignment Precision: Eyeballed manual layouts versus automated, perfect 12-column pixel grids.

- Brand Consistency: Font and margin drift over time versus 100% lock to corporate style guides.

- Widescreen Compliance: Hard manual formatting versus native, vector 16:9 widescreen PPTX layouts.

- Core Frameworks: Hand-drawn TAM/SAM/SOM shapes versus built-in, ready-to-use template components.

- Average Design Cost: High designer fees versus cost-effective Pro subscription plans.

This comparison proves that AI automation dramatically reduces operational friction, ensuring your strategic team spends their valuable hours analyzing data rather than fixing slide alignments.