Maritime Logistics and Shipping Decarbonization Roadmap Template

Stop wasting hours on manual formatting. Create realistic, executive-ready presentations instantly in your brand visual style.

Turn fleet emissions, fuel pathway choices, port constraints, and regulatory exposure into an executive-ready shipping roadmap.
Explain green methanol, ammonia, LNG transition, electrification, efficiency, shore power, and route optimization tradeoffs.
Build slides for shipping lines, ports, logistics companies, cargo owners, investors, and sustainability teams.

1What Is a Maritime Decarbonization Roadmap Deck?

A maritime decarbonization roadmap deck explains how a shipping line, port, logistics operator, cargo owner, or maritime investor will reduce emissions over time. It should connect climate ambition to operational reality: vessel lifecycles, fuel availability, route structure, port infrastructure, safety requirements, regulation, customer contracts, chartering decisions, and capital constraints. The deck usually covers baseline emissions, fleet segmentation, decarbonization levers, alternative fuel pathways, efficiency opportunities, compliance exposure, investment needs, implementation waves, and KPIs. The strongest version avoids treating shipping decarbonization as a single fuel decision. It shows how multiple levers work together across assets, ports, customers, and timelines. This gives executives, fleet teams, port authorities, cargo owners, finance leaders, regulators, and sustainability reviewers enough evidence to evaluate feasibility, emissions impact, cost exposure, infrastructure readiness, adoption risk, and the next investment gate. It also helps teams compare near-term efficiency actions, medium-term fuel pilots, infrastructure dependencies, customer commitments, and capital timing before locking in fleet or port investments.
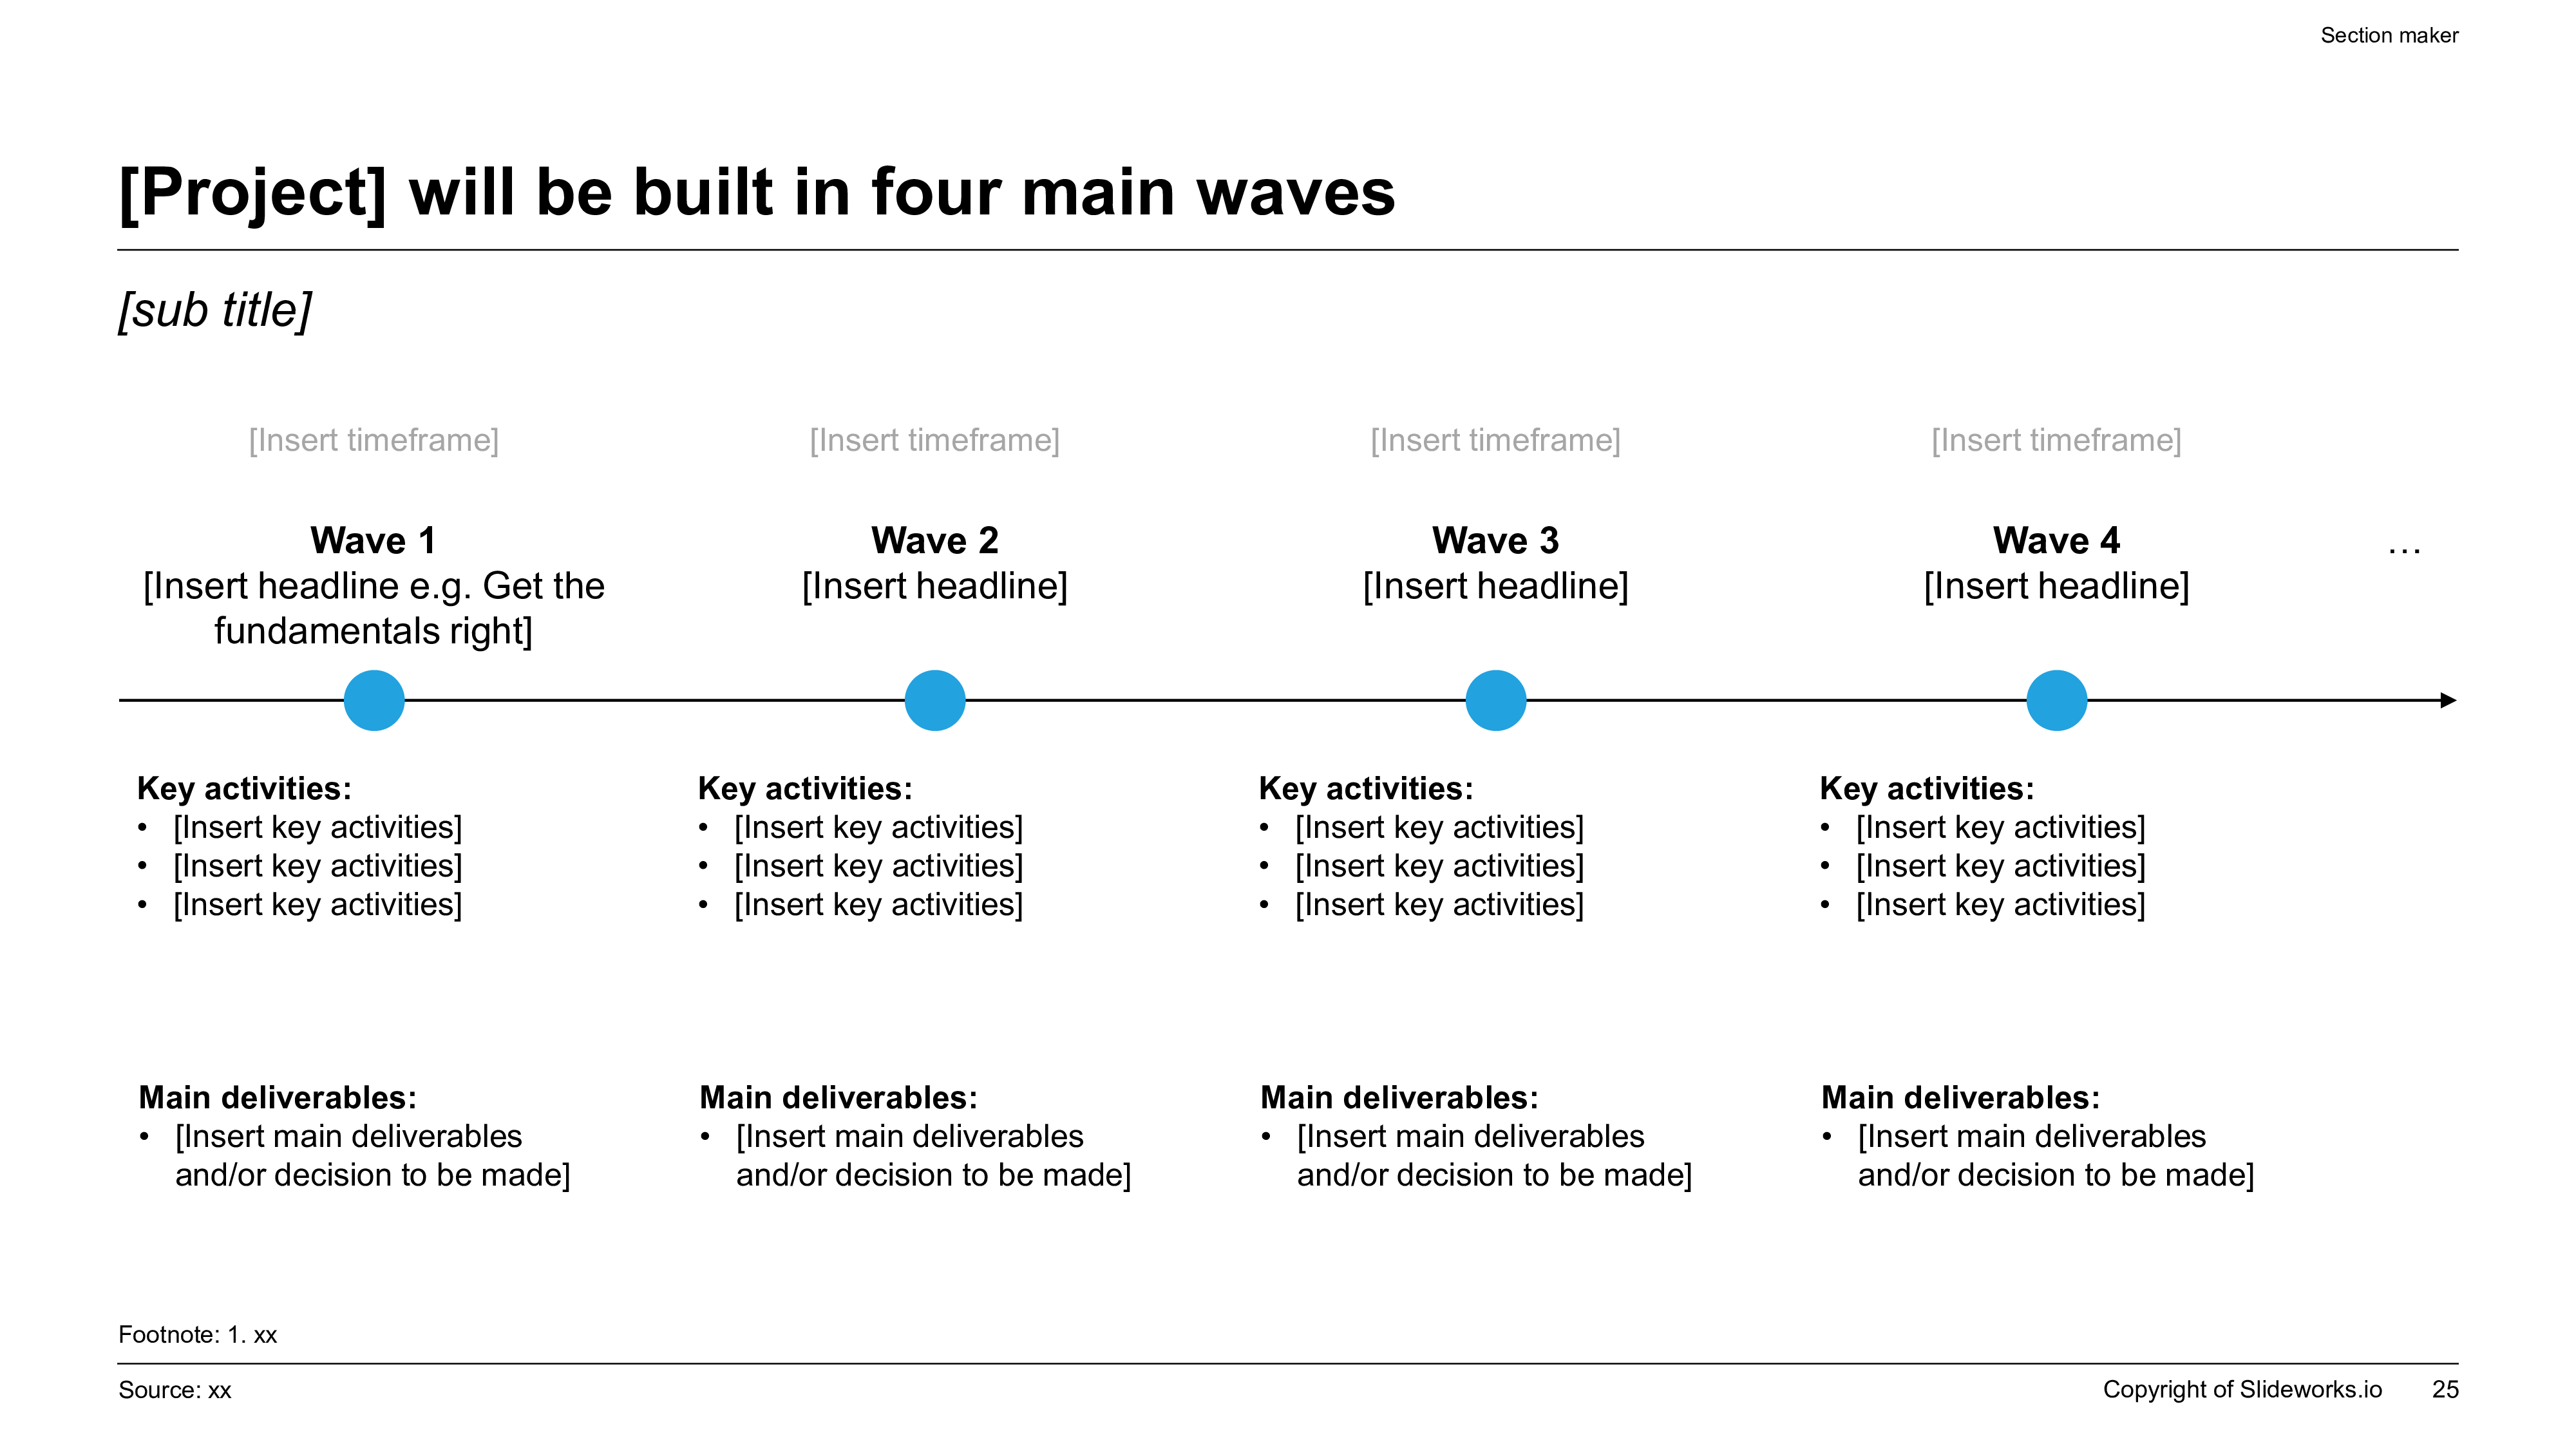
Maritime decarbonization roadmap slide with four horizontal transition waves, key activities, deliverables, and phase sequencing.
Template Design LayoutMaritime Logistics and Shipping Decarbonization Roadmap Template

2When to Use This Shipping Decarbonization Template

Use this template when you need to present a practical maritime emissions reduction plan to senior stakeholders. It works for board strategy sessions, customer sustainability reviews, port planning workshops, investor updates, regulatory compliance discussions, green corridor proposals, fleet renewal plans, and logistics procurement conversations. A carrier can use it to explain vessel transition choices, a port can use it to show infrastructure readiness, and a cargo owner can use it to evaluate lower-carbon shipping options. The template is especially useful when the audience includes both commercial and technical decision makers. It creates a common narrative across emissions baseline, fuel strategy, network implications, economics, and rollout sequencing. This gives executives, fleet teams, port authorities, cargo owners, finance leaders, regulators, and sustainability reviewers enough evidence to evaluate feasibility, emissions impact, cost exposure, infrastructure readiness, adoption risk, and the next investment gate. It also helps teams compare near-term efficiency actions, medium-term fuel pilots, infrastructure dependencies, customer commitments, and capital timing before locking in fleet or port investments.

3Recommended Maritime Roadmap Structure

A strong maritime decarbonization deck should begin with the current emissions baseline by fleet, route, cargo type, fuel use, and operational profile. The next section should explain the regulatory and customer context, including IMO targets, EU ETS exposure, FuelEU Maritime, port requirements, green corridor commitments, and Scope 3 expectations. After that, compare decarbonization levers such as energy efficiency, voyage optimization, slow steaming, shore power, electrification for short routes, biofuels, LNG transition, green methanol, ammonia, hydrogen, and fleet renewal. The roadmap should then sequence pilots, fuel partnerships, vessel investments, infrastructure coordination, procurement decisions, and governance. Close with economics, KPIs, risks, and the executive ask. This gives executives, fleet teams, port authorities, cargo owners, finance leaders, regulators, and sustainability reviewers enough evidence to evaluate feasibility, emissions impact, cost exposure, infrastructure readiness, adoption risk, and the next investment gate. It also helps teams compare near-term efficiency actions, medium-term fuel pilots, infrastructure dependencies, customer commitments, and capital timing before locking in fleet or port investments.

4Fleet Baseline, Emissions Data, and Segmentation

The baseline section needs enough detail to make the roadmap credible. It should show emissions by vessel class, age, fuel type, route, utilization, cargo mix, chartering model, and regulatory exposure. Different segments may need different pathways: deep-sea container vessels, tankers, bulk carriers, ferries, harbor craft, offshore support vessels, and short-sea shipping will not decarbonize at the same pace. The deck should clarify what data is measured, estimated, or missing, and how emissions factors are applied. It should also separate operational emissions from supply chain and port-related emissions where relevant. A strong baseline makes it easier to prioritize where action will create the largest impact. This gives executives, fleet teams, port authorities, cargo owners, finance leaders, regulators, and sustainability reviewers enough evidence to evaluate feasibility, emissions impact, cost exposure, infrastructure readiness, adoption risk, and the next investment gate. It also helps teams compare near-term efficiency actions, medium-term fuel pilots, infrastructure dependencies, customer commitments, and capital timing before locking in fleet or port investments.

5Fuel Pathways, Efficiency Levers, and Technology Options

The fuel and technology section should compare options clearly rather than promoting one answer. Energy efficiency measures may include hull coatings, air lubrication, waste heat recovery, wind assistance, propeller upgrades, digital voyage optimization, and speed management. Fuel pathways may include sustainable biofuels, LNG as a transition option, green methanol, ammonia, hydrogen, battery-electric systems for short routes, and shore power. Each option should be evaluated on emissions reduction potential, fuel availability, infrastructure requirements, safety implications, vessel compatibility, cost, regulatory fit, and maturity. The deck should also show which options are near-term actions, medium-term pilots, and longer-term bets. This gives executives, fleet teams, port authorities, cargo owners, finance leaders, regulators, and sustainability reviewers enough evidence to evaluate feasibility, emissions impact, cost exposure, infrastructure readiness, adoption risk, and the next investment gate. It also helps teams compare near-term efficiency actions, medium-term fuel pilots, infrastructure dependencies, customer commitments, and capital timing before locking in fleet or port investments.

6Port Readiness, Green Corridors, and Partner Ecosystem

Maritime decarbonization depends on infrastructure beyond the vessel. The roadmap should explain which ports can support alternative fuels, shore power, bunkering, safety procedures, storage, permitting, and emergency response. Green corridor planning may require coordination among ports, carriers, cargo owners, fuel producers, terminals, governments, and financiers. The deck should identify critical partners, dependency risks, commercial agreements, and sequencing requirements. A useful slide can map routes against fuel availability, port readiness, cargo demand, and investment timing. This prevents the roadmap from promising vessel changes before the supporting ecosystem exists. It also helps stakeholders understand where collaboration is required. This gives executives, fleet teams, port authorities, cargo owners, finance leaders, regulators, and sustainability reviewers enough evidence to evaluate feasibility, emissions impact, cost exposure, infrastructure readiness, adoption risk, and the next investment gate. It also helps teams compare near-term efficiency actions, medium-term fuel pilots, infrastructure dependencies, customer commitments, and capital timing before locking in fleet or port investments.

7Regulation, Customer Demand, and Commercial Strategy

The commercial case for maritime decarbonization is shaped by regulation and customer demand. The deck should explain which rules affect the organization, how compliance costs may evolve, and where early action creates advantage. It should also show whether cargo owners are willing to pay for lower-carbon service, sign long-term contracts, participate in green corridors, or share fuel premiums. Commercial strategy may include green shipping products, book-and-claim models, emissions reporting, customer segmentation, surcharge design, and procurement partnerships. The roadmap should avoid assuming unlimited willingness to pay. Instead, it should show evidence from customers, pilots, tenders, and regulatory scenarios. This gives executives, fleet teams, port authorities, cargo owners, finance leaders, regulators, and sustainability reviewers enough evidence to evaluate feasibility, emissions impact, cost exposure, infrastructure readiness, adoption risk, and the next investment gate. It also helps teams compare near-term efficiency actions, medium-term fuel pilots, infrastructure dependencies, customer commitments, and capital timing before locking in fleet or port investments.

8Cost Curve, Capital Plan, and Funding Logic

A maritime decarbonization roadmap needs a disciplined economics section. The deck should compare abatement cost by lever, fuel premium, vessel retrofit cost, newbuild cost, infrastructure investment, operating impact, maintenance implications, and compliance savings. It should show what can be funded through operating budgets, what requires capital approval, and where partnerships or public incentives may help. A cost curve can help prioritize efficiency actions before larger fuel-transition investments. Finance leaders will also want to see sensitivity to fuel prices, carbon prices, utilization, customer premiums, and asset life. The goal is not to produce a perfect forecast, but to make investment tradeoffs transparent. This gives executives, fleet teams, port authorities, cargo owners, finance leaders, regulators, and sustainability reviewers enough evidence to evaluate feasibility, emissions impact, cost exposure, infrastructure readiness, adoption risk, and the next investment gate. It also helps teams compare near-term efficiency actions, medium-term fuel pilots, infrastructure dependencies, customer commitments, and capital timing before locking in fleet or port investments.

9Implementation Waves, Governance, and KPIs

The implementation roadmap should sequence action in waves. Wave one may focus on baseline data, efficiency improvements, customer engagement, route prioritization, and pilot design. Wave two may launch fuel trials, port partnerships, shore power projects, procurement agreements, and emissions reporting improvements. Wave three may scale green corridors, vessel retrofits, newbuild decisions, and commercial green products. Wave four may institutionalize portfolio-wide transition planning and continuous optimization. Each wave should have owners, milestones, dependencies, risks, and decision gates. KPIs should include emissions intensity, absolute emissions, fuel mix, energy efficiency, compliance cost, green revenue, pilot performance, port readiness, and capital deployment. This gives executives, fleet teams, port authorities, cargo owners, finance leaders, regulators, and sustainability reviewers enough evidence to evaluate feasibility, emissions impact, cost exposure, infrastructure readiness, adoption risk, and the next investment gate. It also helps teams compare near-term efficiency actions, medium-term fuel pilots, infrastructure dependencies, customer commitments, and capital timing before locking in fleet or port investments.

10How XLSlides Speeds Up Maritime Roadmap Planning

XLSlides helps maritime teams turn fleet data, emissions notes, fuel research, regulatory requirements, port readiness inputs, customer commitments, and investment assumptions into a structured decarbonization roadmap faster. The AI workflow can organize the narrative into baseline, regulation, fuel pathways, efficiency levers, port ecosystem, commercial strategy, cost curve, implementation waves, governance, KPIs, and executive ask. This is useful when shipping and logistics teams have complex inputs but need a clear deck for leadership, customers, investors, or partners. The generated output is not a substitute for naval engineering, safety review, regulatory advice, or financial modeling, but it gives teams a strong working draft. This gives executives, fleet teams, port authorities, cargo owners, finance leaders, regulators, and sustainability reviewers enough evidence to evaluate feasibility, emissions impact, cost exposure, infrastructure readiness, adoption risk, and the next investment gate. It also helps teams compare near-term efficiency actions, medium-term fuel pilots, infrastructure dependencies, customer commitments, and capital timing before locking in fleet or port investments.