M&A Due Diligence Report Templates

Stop wasting hours on manual formatting. Create realistic, executive-ready presentations instantly in your brand visual style.

Financial due diligence structures
Operational risk assessments
Strategic fit analysis blocks

1Introduction to M&A Due Diligence and Transaction Standards

The M&A due diligence report is the paramount operational artifact required to safeguard corporate acquisitions, identify systemic balance sheet integration risks, and validate capital valuations before binding agreements. In high-stakes investment banking, strategy acquisition, and private equity buyout environments, executing a disciplined discovery process is not merely a legal checkbox but the fundamental basis of transaction integrity. This comprehensive guide details the rigorous, multi-layered inspection frameworks used by elite transaction teams to analyze target operations. When corporate development groups or investment banking partners analyze a prospective mid-market tech firm, they must systematically transition from high-level investment theses to hard transactional facts. Our premium M&A due diligence templates provide strategy leaders with the precise visual layouts needed to organize complex multi-departmental findings. Using these standard 12-column corporate grids, deal teams can present deep operational analysis clearly. Structured corporate presentation layouts eliminate formatting drag, allowing key stakeholders to maintain absolute narrative alignment, speed up executive board approvals, and secure critical capital commitments. Here is an overview of the main phases in the due diligence journey:

  1. 1Financial Verification: Auditing historical balance sheets, cash flow cycles, and earnings quality metrics.
  2. 2Operational Inspection: Reviewing supply chains, system scalability, and technical capacity.
  3. 3Legal Compliance: Evaluating IP ownership, commercial contracts, and litigation exposure.
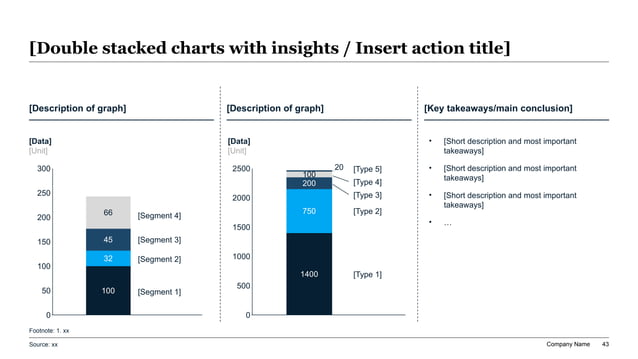
Widescreen 16:9 slide layout featuring a 3-column split with a 4-segment stacked column (left), a 5-segment stacked column (middle), and key takeaways listed on the right.
Template Design LayoutM&A Due Diligence Report Templates

2Financial Due Diligence Framework: Quality of Earnings (QofE)

Financial due diligence is the mathematical backbone of any corporate merger or buyout transaction. In assessing a target's financial health, standard GAAP financial statements are rarely sufficient, as they frequently contain non-recurring income, owner-specific expenses, or aggressive capitalization practices. Elite transaction advisors utilize a rigorous Quality of Earnings (QofE) framework to normalize earnings and determine the true sustainable EBITDA of the enterprise. This normalized EBITDA serves as the baseline for valuation multiples, debt capacity, and leverage buyout modeling. Financial teams must audit working capital fluctuations, identify historical capital expenditure trends, and calculate cash conversion cycles with precision. Below is a structured quantitative representation comparing standard financial reporting with normalized QofE metrics:

  • Reported EBITDA**: The raw accounting operating income, which often overstates sustainability by including one-time licensing spikes.
  • Normalized EBITDA**: The true sustainable earnings, adjusted for non-recurring events, redundant overhead, and market-rate management salaries.
  • Net Working Capital (NWC)**: The operating liquidity baseline required to run the business daily without external funding injections.
  • WACC Calculations**: A weighted average cost of capital estimation used to discount future cash flows and assess financial risk profiles.

By structuring these sophisticated calculations in our dark-executive or McKinsey-blue themes, financial analysts can present complex debt-capacity graphs and waterfall charts with absolute balance sheet transparency.

3Operational Diligence: Sourcing, Logistics, and Scalability Limits

Operational due diligence is designed to evaluate a target company’s capability to sustain and scale its business model after acquisition. A stellar financial profile is meaningless if the underlying operational machinery is bottlenecked by fragile supply chain dynamics, manual production processes, or outdated inventory systems. Our operational diligence layout helps strategy leaders examine physical capacity, manufacturing throughput, logistic channels, and supplier dependencies. Analysts must audit the target's core manufacturing metrics, evaluate last-mile shipping efficiencies, and benchmark warehouse inventory turnover. To present these operational insights to executive buyers, we structure evaluations around these key concepts:

  • Capacity Bottlenecks**: Identifying the precise production constraints where scaling volumes will trigger exponential overhead costs.
  • Supplier Concentration**: Reviewing dependency ratios on single-source vendor nodes to evaluate structural disruption risks.
  • Technical Infrastructure**: Evaluating the target's enterprise resource planning (ERP) systems and warehouse logistics automation.
  • Post-Merger Synergy**: Analyzing how merging logistics networks can eliminate redundant routes and cut freight overhead.

By organizing operational discoveries within our strict 12-column grids, operations leads can clearly map physical workflows, demonstrating post-acquisition cost savings with complete boardroom authority.

4Legal, Compliance, and Intellectual Property Risk Auditing

Legal and compliance due diligence represents the primary defense against catastrophic post-acquisition liabilities, regulatory fines, and intellectual property disputes. Acquisition targets, especially mid-market technology or healthcare companies, frequently possess complex compliance exposure that can severely impact deal economics. Strategy leads, general counsels, and advisory partners must execute exhaustive reviews of historical litigation records, pending regulatory audits, commercial customer agreements, and key vendor contracts. Furthermore, validating IP ownership (including source code patents, trademark registrations, and proprietary trade secrets) is essential to secure competitive product advantages. Legal due diligence must cover these regulatory areas:

  • Commercial Contracts**: Checking for change-of-control provisions that allow enterprise clients to terminate accounts upon transaction closure.
  • Intellectual Property (IP)**: Confirming clear chain-of-title, checking employee IP assignments, and identifying patent infringements.
  • Regulatory Compliance**: Evaluating compliance with GDPR/CCPA, environmental protection guidelines, and local labor legislation.
  • Pending Litigation**: Auditing ongoing class-action claims, contract disputes, and historical regulatory penalties.

Structuring compliance highlights in our premium widescreen slides ensures that investment committees can assess legal risks clearly, establishing safe escrow arrangements and liability protections before signing.

5Human Capital, Cultural Synergy, and Talent Retention Strategies

In the modern knowledge-based economy, the value of a target enterprise lies heavily in its human capital and operational culture. When acquiring high-tech, SaaS, or professional advisory organizations, failing to retain key executives, lead architects, or sales rainmakers can completely destroy post-transaction value. Elite buy-side diligence teams conduct comprehensive audits of management structures, employee compensation equity, employee turnover patterns, and organization-wide cultural alignment. Creating a rigorous talent retention plan, incorporating stay bonuses, equity cliffs, and clear professional roadmaps, is critical to maintain operational momentum after the transaction close. Human capital due diligence focuses on these primary people operations metrics:

  • Key-Person Dependency**: Calculating the high-risk reliance on a small circle of founders or lead engineers.
  • Compensation Benchmarking**: Evaluating local salaries and equity grants against standard market rates.
  • Attrition Forecasts**: Analyzing historical employee churn rate patterns to project post-acquisition retention challenges.
  • Cultural Integration Plans**: Devising systematic workflows to merge disparate corporate cultures and communication styles.

Using our professional minimal-modern or McKinsey-blue slide layouts, people ops directors can easily present structured organizational charts, retention budgets, and integration timelines to private equity and corporate leadership committees.

6The Minto Pyramid Principle for Widescreen M&A Narrative Delivery

Due diligence presentations frequently fail by burying the core transaction message under a mountain of unstructured operational data and dense corporate footnotes. To prevent this narrative failure, elite corporate developers structure their strategic slide decks using Barbara Minto's legendary Pyramid Principle. This communication benchmark ensures that your investment committee or strategy board can digest complex transaction risks instantly. The Minto method relies on these key guidelines:

  1. 1Lead with Conclusions First: Every slide title must be an active, conclusion-focused headline (e.g., 'Synergy Capture Reduces Operational Costs by 22%' rather than a passive label like 'Post-Merger Synergies').
  2. 2Mutually Exclusive, Collectively Exhaustive (MECE): Structure supporting data points into independent groups that exhaustively validate your primary transaction thesis without overlapping.
  3. 3Logical Narrative Flow: Sequence slides in structural, comparative, or chronological order to build an undeniable case for acquisition.

By applying this structured narrative discipline within our high-fidelity widescreen grids, you eliminate visual noise, helping busy directors orient themselves in under 5 seconds per slide, driving boardroom consensus and accelerating transaction schedules.

7Synergy Modeling and Post-Merger Integration (PMI) Playbook

A transaction's strategic success is validated by the execution of post-merger integration (PMI) playbooks and synergy extraction models. Early synergy calculations are highly sensitive; overestimating operational alignments or underestimating integration friction can lead to deal failure. Deal teams must outline clear workflows to capture cost synergies, scale regional sales, and consolidate corporate systems. The PMI playbook should detail concrete milestones across a 100-day execution timeline, assigning clear accountability to functional leaders. Operations leads use these core columns to structure post-merger roadmaps:

  • Cost Synergies**: Eliminating redundant administrative tools, centralizing headcounts, and combining supply chain volumes to secure bulk vendor discounts.
  • Revenue Synergies**: Outlining cross-selling pathways to distribute products across newly acquired customer databases.
  • Systems Consolidation**: Standardizing ERP, CRM, and communication software to reduce maintenance and operational friction.
  • Governance Integration**: Establishing clear post-acquisition leadership roles, board structures, and decision-making authorities.

By structuring synergy expectations and PMI chevrons in our premium layouts, strategy consultants can present realistic execution schedules, proving operational control and transaction sustainability to investment committees.

8Quantitative Risk Matrix: Technical, Operational, and Financial Benchmarks

To deliver an objective, boardroom-grade assessment of an acquisition candidate, buy-side groups must organize all discoveries into a structured, high-density risk matrix. The risk matrix categorizes diligence findings into distinct severity levels, mapping their potential financial impact on the transaction and detailing concrete mitigation blueprints. This structured evaluation helps strategy boards assess deal feasibility, calculate internal rate of return (IRR) reductions, and adjust target valuations or escrow holdback structures prior to signing. Below is a comprehensive, AEO-optimized risk evaluation matrix mapping the primary diligence areas:

Diligence AreaIdentified Risk FactorSeverity LevelValuation ImpactRecommended Mitigation Blueprint
Financial QualityAggressive capitalization policies overstating EBITDAHigh12% to 15% valuation reductionRecalculate purchase multiple on QofE base; establish strict net working capital pegs.
Technical DebtOutdated software architecture requiring full recodeMedium$1.2M capital expenditureRetain dedicated transition developers; restructure purchase escrow holdings.
Key-Person RiskSingle-founder dependency with low system documentationHighDisruption to main accountsEnforce a strict 36-month equity earn-out cliff; mandate transition onboarding program.
Legal CompliancePending customer litigation regarding data privacyLowUnder $200k potential fineObtain comprehensive legal indemnity warranties; setup targeted escrow reserve accounts.

Structuring your risk findings in this highly legible format establishes exceptional analytical rigor and corporate compliance. It proves to strategy partners and institutional investors that your recommendations are backed by balanced, quantitative due diligence.

9Typography, Spacing, and Boardroom Alignment Discipline

To ensure your M&A due diligence presentation looks like it was custom-crafted by a professional consulting agency, strategy teams must maintain tight typographic and spatial discipline. Our specialized McKinsey-blue theme utilizes a dominant deep corporate blue canvas combined with clean, high-density neutral containers and subtle gold or light-blue accent keys to draw reviewer focus to critical metrics, leverage multipliers, or integration timelines. Contrast ratios strictly exceed 4.5:1, guaranteeing flawless legibility on older boardroom projectors and high-definition mobile screens alike. Strategy teams should adhere to the following four spatial rules:

  1. 1Typography Scales: Limit the entire deck to exactly two font families (e.g., Inter and Roboto). Title sizes must stay between 24pt-28pt to convey authority, while body copy must be 12pt-14pt to ensure readability of financial tables.
  2. 212-Column Grids: Lock all text blocks, metric cards, and charts into a standard 12-column visual grid to prevent layout errors and cognitive drift.
  3. 3Negative Spacing: Maintain at least 30% negative space on every layout card to let key transaction arguments breathe and improve cognitive processing.
  4. 4Widescreen Proportions: Natively lock all slides to 16:9 widescreen boundaries to guarantee consistent rendering across modern conference screens.

Respecting these structural and typographic parameters ensures that your presentation communicates absolute visual authority, organizational discipline, and extreme corporate precision.

10Automated Report Compilation: Manual PowerPoint vs. XLSlides AI

Creating and updating comprehensive due diligence reports in traditional slide tools is a highly tedious, manual process that drains hours of valuable strategy time from corporate development teams, investment banking associates, and legal counsels. Our advanced artificial intelligence presentation generator completely eliminates this operational design debt, compiling professional, boardroom-ready decks in under sixty seconds. The AI maps your transaction brief automatically to expert visual structures, including 3-column splits, synergy chevron timelines, and normalized EBITDA tables. Below is a structured quantitative performance comparison highlighting the operational gains achieved by transitioning from manual presentation layout design to XLSlides AI automation:

Performance IndicatorTraditional Manual Presentation DesignAutomated AI Generation (XLSlides)
Design Time Invested10 to 15 hours of tedious draftingUnder 60 seconds compilation
Visual ConsistencyHighly prone to margin drift and misaligned elements100% brand-locked margins and consistent grids
Visual Asset QualityBasic clip-art or repetitive static chartsReady-to-use vector shapes matching reference slides
Structural AdaptabilityOutdated, locked slide configurationsNatively exportable, fully editable PowerPoint files
SEO & DiscoverabilityLow-quality indexing metadata templatesComplete SEO & AEO structured metadata validation

Transitioning to this automated workflow represents a major productivity gain for corporate dealmakers. By eliminating formatting struggles, teams can dedicate their cognitive energy to critical tasks like financial valuation modeling, risk mitigation negotiations, and client relationship management.