Competitive Benchmarking Report Presentation Templates

Stop wasting hours on manual formatting. Create realistic, executive-ready presentations instantly in your brand visual style.

Feature comparison matrices
Market share visualizations
SWOT & gap analysis blocks

1The Strategic Importance of Competitor Benchmarking in Corporate Strategy

In the modern corporate landscape, establishing a robust market position requires more than tracking internal performance metrics. Competitor benchmarking is a critical strategic discipline that enables corporate strategy leads, management consultants, and finance partners to evaluate their firm's performance relative to the market. By systematically analyzing competitors' operational models, product portfolios, and financial health, organizations can identify strategic gaps and uncover new growth opportunities. This rigorous process is essential for informing high-stakes decisions, such as market entry, capital allocation, and M&A activity. When presenting benchmarking findings to the board of directors or investment committees, using professional widescreen slides is crucial. Boardroom-ready slide layouts project analytical rigor and operational maturity, ensuring that strategic recommendations are backed by objective data rather than speculation. Ultimately, benchmarking allows companies to move from reactive market monitoring to proactive strategic positioning, safeguarding long-term competitiveness and driving sustainable value creation for shareholders and institutional investors alike. To succeed in this effort, companies must establish clear governance rules for data acquisition, ensuring that all competitive tracking respects intellectual property laws and compliance protocols while still capturing the insights necessary to steer corporate direction.
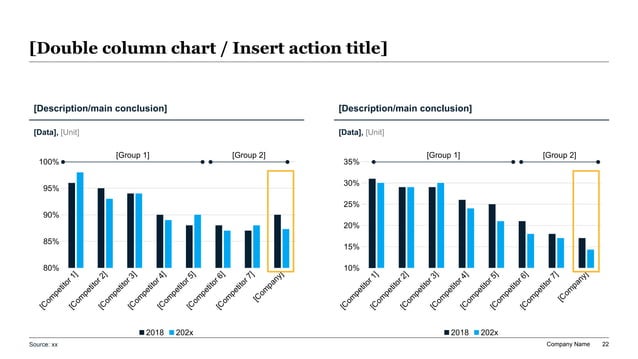
McKinsey-style competitor benchmarking slide featuring dual vertical bar charts comparing market share, growth metrics, and volume performance against a highlighted company column.
Template Design LayoutCompetitive Benchmarking Report Presentation Templates

2Structuring Benchmarking Reports with the Minto Pyramid Principle

When presenting competitor benchmarking reports to C-suite executives or private equity sponsors, communication clarity is paramount. Strategy teams often make the mistake of presenting vast amounts of raw data without a clear narrative, leading to decision paralysis. To avoid this, consultants must structure their presentation using Barbara Minto’s Pyramid Principle. This professional framework dictates that slides must lead with the conclusion first. Instead of using a passive header like "Competitor Feature Comparison," the slide must feature an active, conclusion-driven headline such as "Our Proprietary Feature Set Accelerates Customer Acquisition by Thirty Percent Over Key Competitors." Supporting data, competitor matrices, and market share charts must represent mutually exclusive, collectively exhaustive (MECE) sub-elements that validate this core message. Structuring your slides this way ensures that busy board directors can grasp the key strategic takeaways in under ten seconds, accelerating alignment and facilitating rapid, data-driven decisions during high-stakes corporate reviews. This structured narrative discipline eliminates visual clutter and ensures that key competitive advantages are immediately apparent to stakeholders.

3Designing a MECE Feature Comparison Matrix for Product Positioning

A core component of any competitive analysis report is the feature comparison matrix, which maps product capabilities across competitors. To ensure the integrity of the analysis, strategy teams must construct a Mutually Exclusive and Collectively Exhaustive (MECE) feature taxonomy. This structural standard ensures that every product feature is assigned to a specific category with zero overlap between classes, preventing double-counting or structural confusion. By dividing the comparison into distinct, non-overlapping capability areas—such as core platform performance, integration APIs, security compliance, and customer service delivery—strategy leads can objectively evaluate where their product excels and where critical feature gaps exist. The checklist below highlights the core capability categories that strategy teams must include in their competitive product positioning matrix:

  • Core Platform Capabilities** - Evaluation of primary functional performance and user experience relative to the market standard.
  • API Integration Infrastructure** - Auditing of developer interfaces, data transfer protocols, and third-party software compatibility metrics.
  • Security & Regulatory Compliance** - Assessment of data encryption standards, regional certifications, and privacy governance models.
  • Customer Support SLA Metrics** - Analysis of support availability, resolution speed, and dedicated customer success resources.

Presenting these capabilities in a clean, visual grid helps the executive committee identify immediate product development priorities and allocate R&D budgets effectively.

4Visualizing Market Share Dynamics and Volume Performance

To communicate competitive standing effectively, strategy teams must use high-fidelity visual assets that convey complex market dynamics at a glance. For this competitor benchmarking report template, we suggest utilizing our premium widescreen dual bar chart slide asset, which compares market share and growth metrics side-by-side. The left chart displays competitor market shares, while the right chart highlights volume growth performance over the past fiscal period. The company's own column is highlighted using a high-contrast corporate accent color to instantly draw the viewer's eye. This dual-axis visualization helps stakeholders quickly correlate market share size with relative growth momentum, identifying which competitors are gaining traction and which are losing market dominance. Presenting this volume performance data in a structured, professional slide format demonstrates operational rigor, eliminates the visual clutter of legacy spreadsheets, and ensures the board of directors can easily digest critical market trends during annual strategic planning sessions. Furthermore, including clear CAGR indicators above each competitor column helps the audience quickly evaluate long-term trends and spot emerging market disruptors before they pose a significant threat to our core business lines.

5Analyzing Competitive Cost Structures and Operational Benchmarks

Understanding a competitor’s financial health and cost efficiency is crucial for developing defensive pricing strategies and optimizing internal operations. Finance directors and corporate development leads must perform detailed operational benchmarking, comparing cost structures, SG&A margins, and asset turnover ratios against industry peers. Since competitor financial data is often aggregated, analysts must employ estimation models and industry benchmarks to build a reliable comparison. Presenting these financial comparisons in a high-density, structured data table provides the board of directors with a transparent overview of relative cost efficiency, highlighting areas where the company can streamline operations or negotiate better vendor contracts. The table below represents a typical corporate competitor financial calibration matrix:

Competitor NameSG&A as % of RevenueOperating Margin %Asset Turnover RatioTarget cost Optimization Focus Area
Alpha Solutions22.5% SG&A Margin18.2% Operating1.4x TurnoverConsolidate regional distribution channels
Beta Corporation18.0% SG&A Margin24.5% Operating1.8x TurnoverOptimize software licensing and cloud costs
Gamma Services28.3% SG&A Margin12.0% Operating1.1x TurnoverRestructure mid-level management tiers
Our Target Profile20.1% SG&A Margin21.4% Operating1.5x TurnoverAccelerate automated invoice reconciliation

By analyzing these operational parameters, finance leaders can identify margin improvement levers and define realistic cost-reduction targets that align with the company's long-term profitability goals.

6Deploying the SWOT Analysis and Gap Remediation Framework

A traditional SWOT (Strengths, Weaknesses, Opportunities, Threats) analysis often degenerates into a superficial list of bullet points that lacks strategic utility. To deliver C-suite value, strategy partners must elevate the SWOT framework into an actionable gap remediation model. Strengths must be mapped directly to market opportunities, while weaknesses must be paired with concrete remediation strategies to mitigate external threats. For instance, if a competitor’s rapid market expansion (Threat) exposes our lack of localized customer support (Weakness), the slide must outline a specific plan to establish regional support hubs within ninety days. Frame these strategic responses from the perspective of an investment committee review or PE/VC deal evaluation, proving that the company has a structured approach to neutralizing risks and leveraging its competitive edge. Presenting a dynamic SWOT-to-Action roadmap demonstrates proactive governance and gives investors confidence that the management team is prepared to navigate competitive headwinds. This structured approach helps teams move beyond passive analysis to active strategic execution, securing long-term market leadership.

7Mapping the Competitive Intelligence Rollout and Governance Roadmap

Establishing a continuous competitive intelligence program requires structured execution and clear governance. Strategy leads must map the program's rollout timeline using a phased roadmap, ensuring that intelligence gathering is integrated into quarterly business planning. The rollout begins with identifying core data sources and competitor profiles, followed by automating data flows and establishing reporting cadences. The timeline must clearly outline key milestones, such as completing the baseline competitor audit, launching real-time market tracking dashboards, and delivering quarterly competitive reports to the board. Structuring these phases visually on a timeline slide demonstrates project management discipline and aligns cross-functional teams around data collection responsibilities. It ensures that product managers, sales leaders, and marketing executives share a unified view of market changes, allowing the firm to react quickly to competitive moves and maintain its strategic edge without operational bottlenecks. By formalizing this competitive intelligence governance framework, leadership can turn sporadic insights into a permanent corporate capability.

8Avoiding Five Common Pitfalls in Competitor Presentation Decks

To secure board alignment and maintain professional credibility during strategic reviews, presenters must avoid several common competitor benchmarking presentation mistakes:

  • Cherry-Picking Competitor Metrics** - Presenting only areas where the company wins while ignoring critical competitor advantages, which undermines strategic trust.
  • Information and Data Overload** - Cramming large, unformatted spreadsheets onto a single slide; keep at least thirty percent negative space to focus attention.
  • Stale or Outdated Benchmarks** - Using financial or product data that is more than one quarter old, failing to reflect active market realities.
  • Lack of Actionable Recommendations** - Presenting benchmarking data without proposing clear strategic adjustments or operational initiatives.
  • Poor Slide Layout Consistency** - Utilizing inconsistent margins, fonts, and colors that distract the board from the underlying data and analysis.

Avoiding these common visual and structural mistakes ensures your competitor report projects operational rigor, builds trust with institutional investors, and leads to rapid strategic consensus.

9Visual Design Standards for High-Contrast Competitor Slides

The visual presentation of competitor benchmarking data directly impacts how analytical insights are received by the board of directors. This template is designed around our "dark-executive" style preset, which projects premium authority and high-density financial focus. The slide design follows a strict 60-30-10 color rule: a 60% dominant deep charcoal background prevents glare and visual fatigue in dark boardrooms, a 30% structured layout grid (using slate-grey card containers) organizes competitor comparison tables and metrics, and a 10% high-contrast accent key (such as vibrant copper or electric gold) highlights key company statistics and competitive advantages. Enforce strict 12-column grid alignment to prevent layout drift, keeping all text blocks and charts perfectly aligned. Furthermore, protect at least 30% negative space on every slide to let the design breathe, ensuring visual excellence and high readability across both high-definition digital screens and corporate projectors. Maintaining these rigorous design standards ensures your presentation commands visual authority, keeping executive attention focused on strategic insights.

10Leveraging XLSlides AI to Automate Competitor Slide Creation

Creating a comprehensive competitor benchmarking presentation manually in PowerPoint is a slow, frustrating task that often consumes ten to fifteen hours of adjusting margins, aligning table grids, and formatting charts. This administrative overhead drains valuable cognitive energy that corporate strategy leads and management consultants should instead spend analyzing market trends, refining competitive messaging, and building execution roadmaps. XLSlides AI automates this layout design process, allowing strategy partners to generate premium, boardroom-ready competitor decks in under sixty seconds. The AI engine performs intelligent, context-aware layout mapping, translating your competitor brief and data tables into structured columns, comparison grids, or dual bar charts. Brand consistency is strictly maintained based on your chosen design preset, preventing font or margin drift. The completed presentation exports as fully editable PowerPoint vector shapes, allowing you to easily adjust metrics, customize copy, or import company branding, boosting productivity and ensuring professional excellence. By delegating the layout design to automated algorithms, strategy teams can focus their efforts on refining strategic messaging and building consensus among key organizational stakeholders, ensuring the final presentation delivers maximum business impact.